Adjust position by dodging overlaps to the side.
See also
Other position adjustments:
position_fill(),
position_identity(),
position_jitter(),
position_jitterdodge(),
position_nudge()
Examples
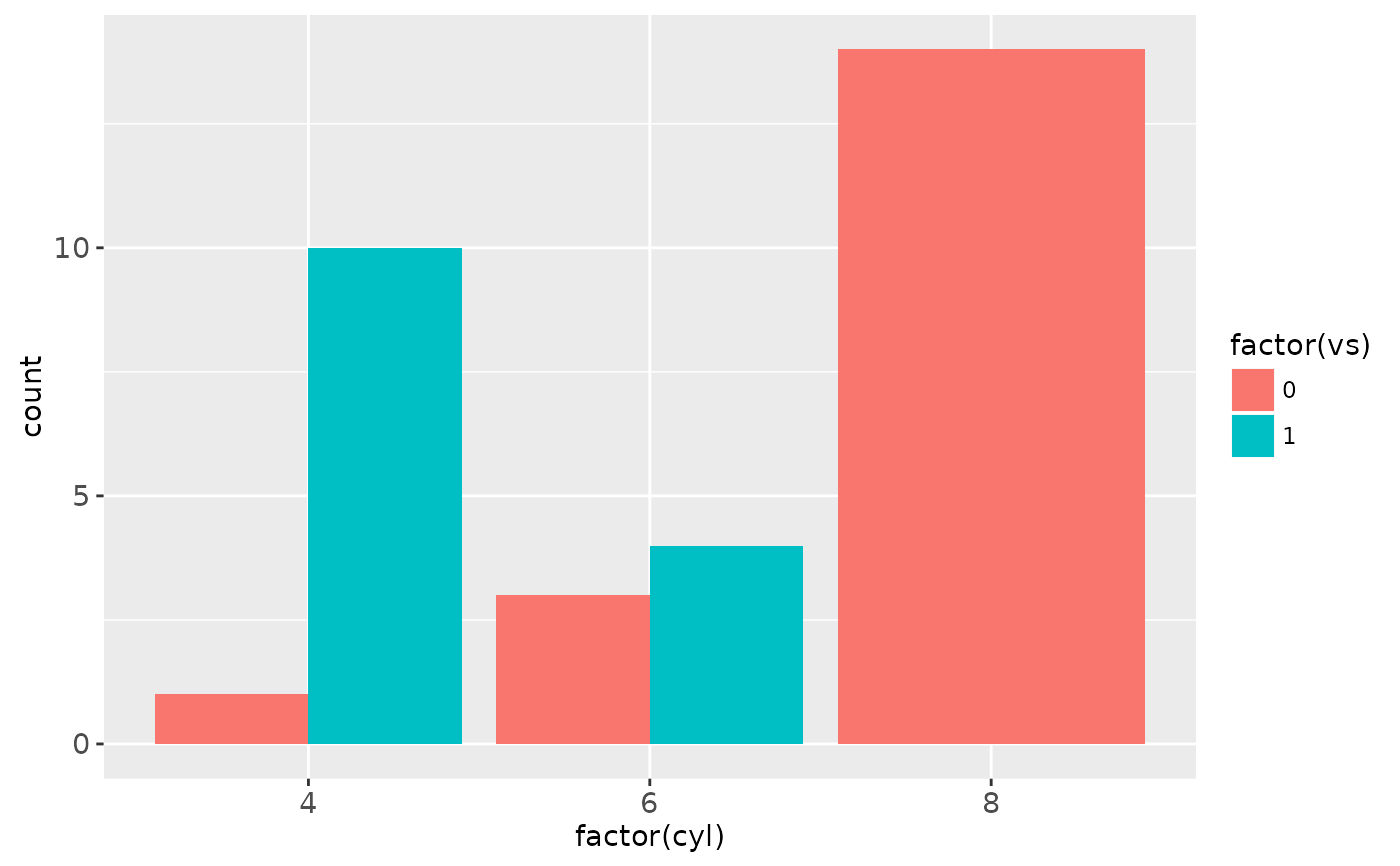
ggplot(mtcars, aes(factor(cyl), fill = factor(vs))) +
geom_bar(position = "dodge")
 # \donttest{
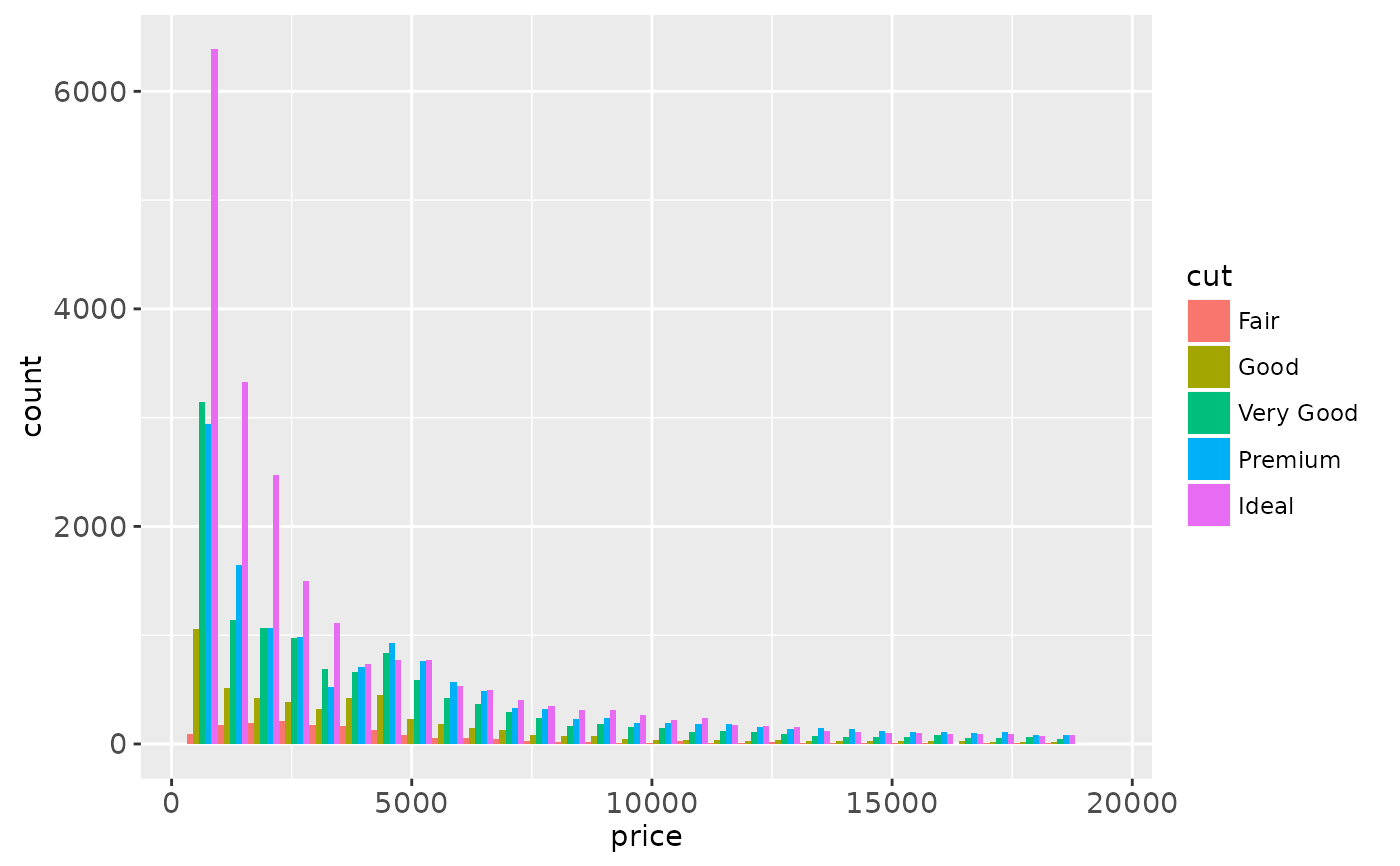
ggplot(diamonds, aes(price, fill = cut)) +
geom_histogram(position="dodge")
#> `stat_bin()` using `bins = 30`. Pick better value with `binwidth`.
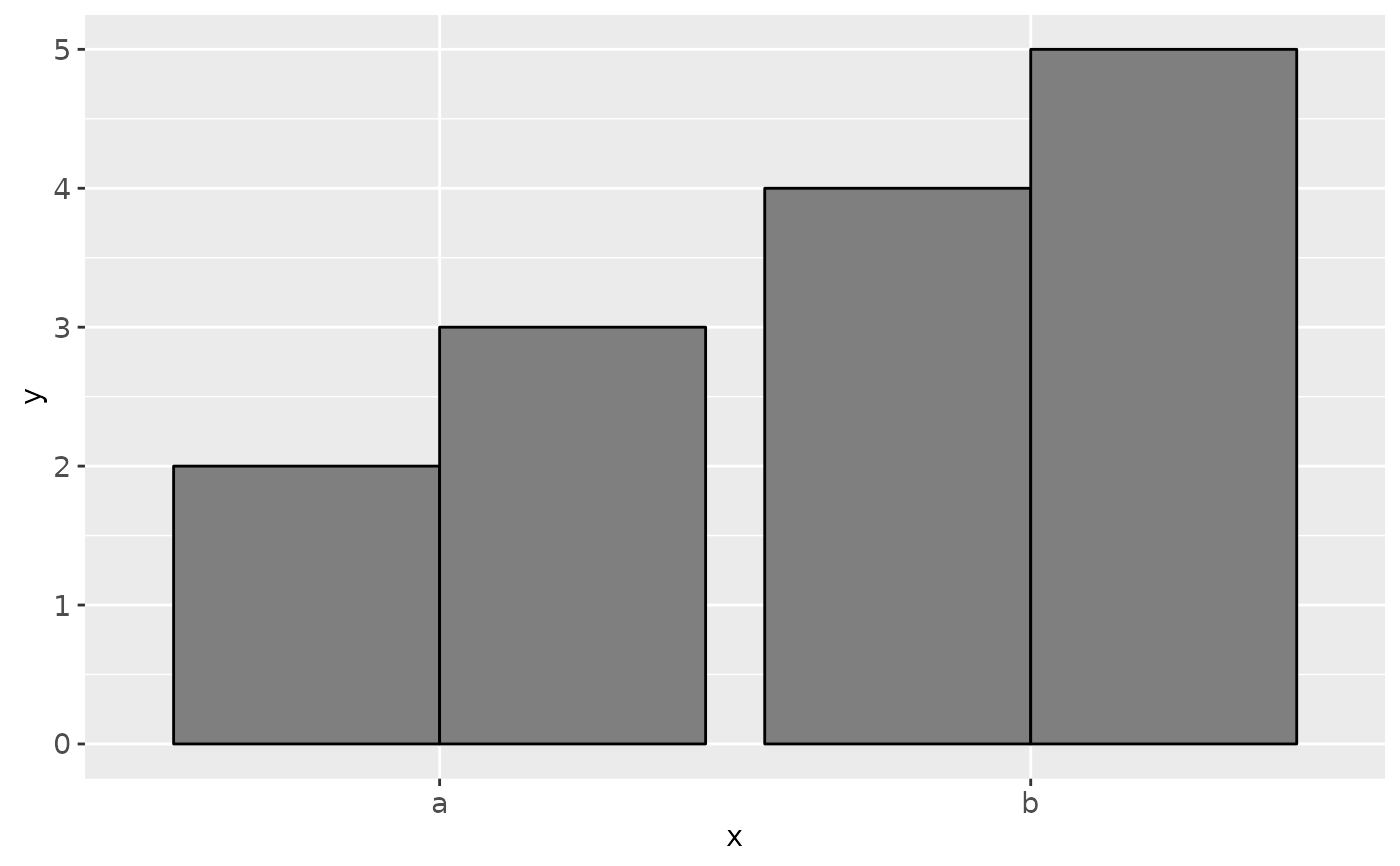
 # To dodge items with different widths, you need to be explicit
df <- data.frame(x = c("a","a","b","b"), y = 2:5, g = rep(1:2, 2))
p <- ggplot(df, aes(x, y, group = g)) +
geom_bar(
stat = "identity", position = "dodge",
fill = "grey50", colour = "black"
)
p
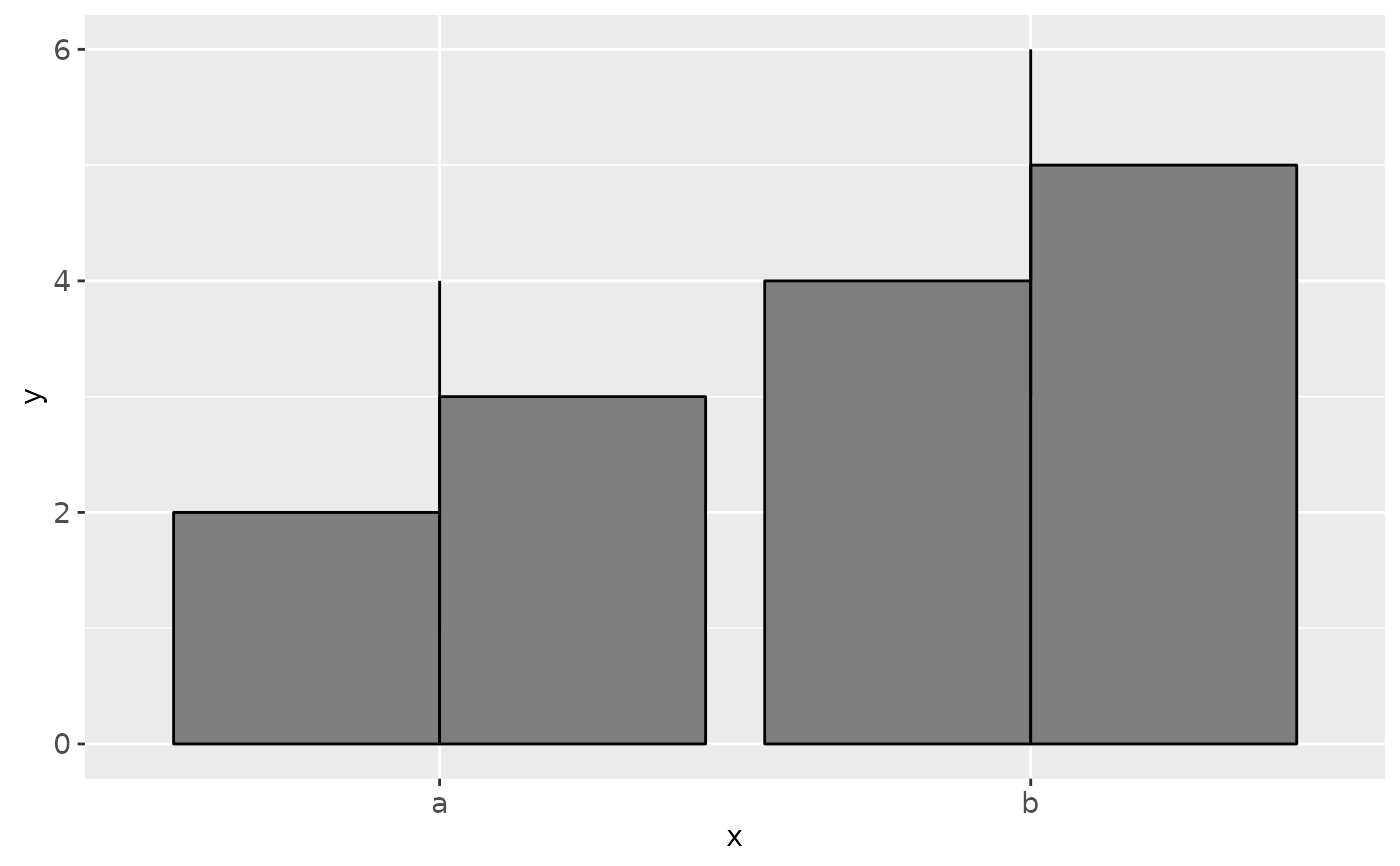
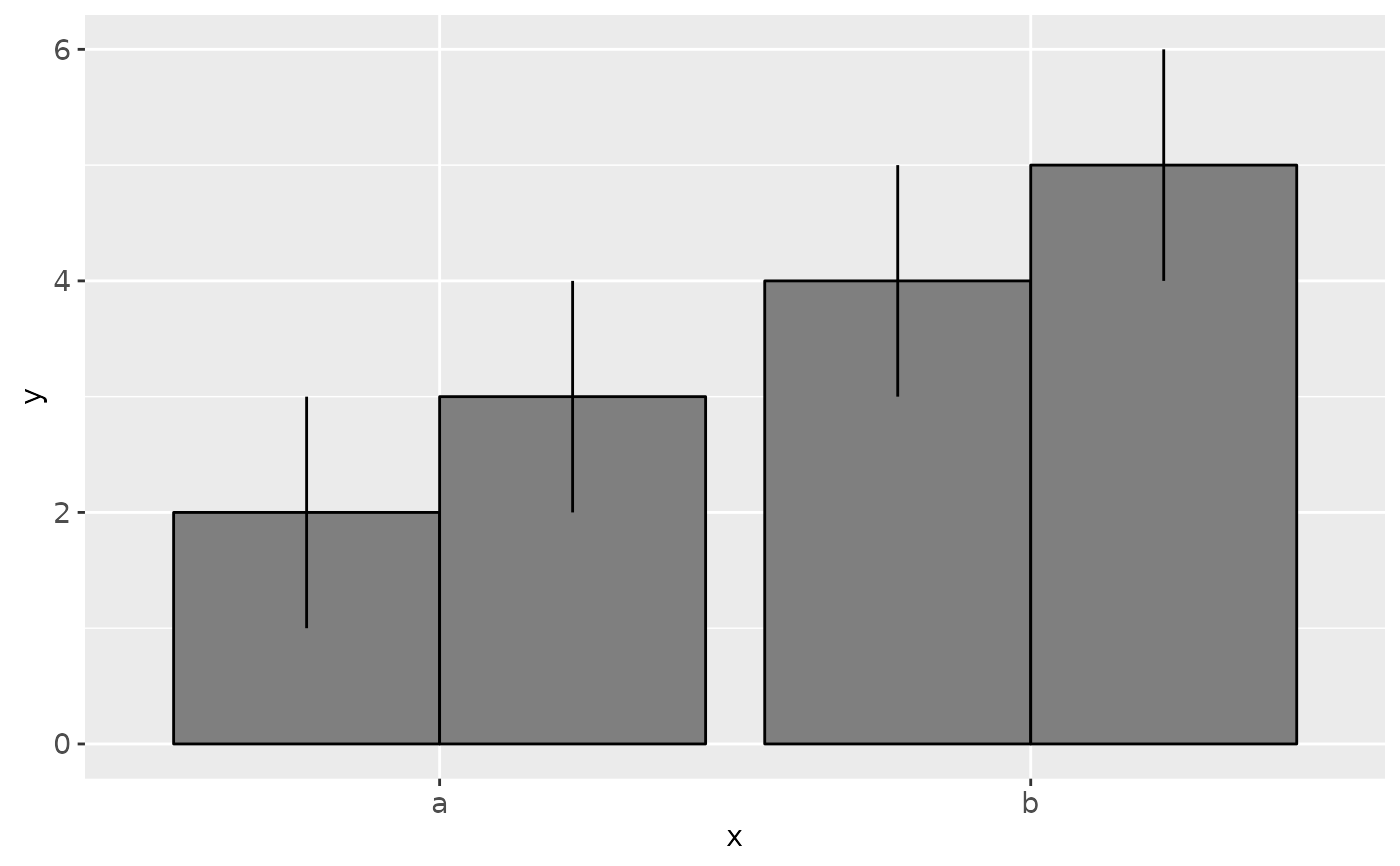
 # A line range has no width:
p + geom_linerange(aes(ymin = y-1, ymax = y+1), position = "dodge")
#> Warning: Width not defined. Set with `position_dodge(width = ?)`
 # You need to explicitly specify the width for dodging
p + geom_linerange(aes(ymin = y-1, ymax = y+1),
position = position_dodge(width = 0.9))
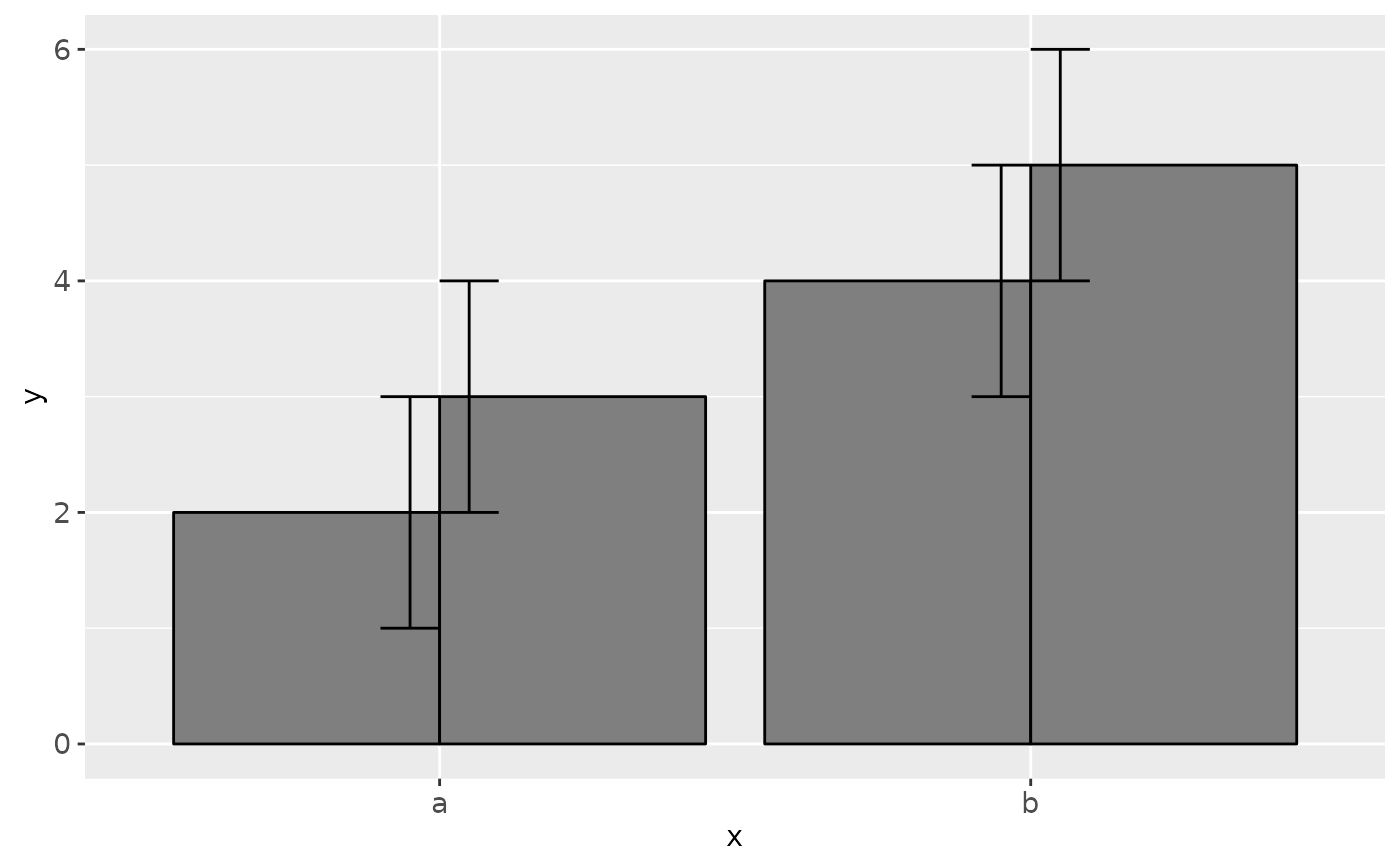
 # Similarly with error bars:
p + geom_errorbar(aes(ymin = y-1, ymax = y+1), width = 0.2,
position = "dodge")
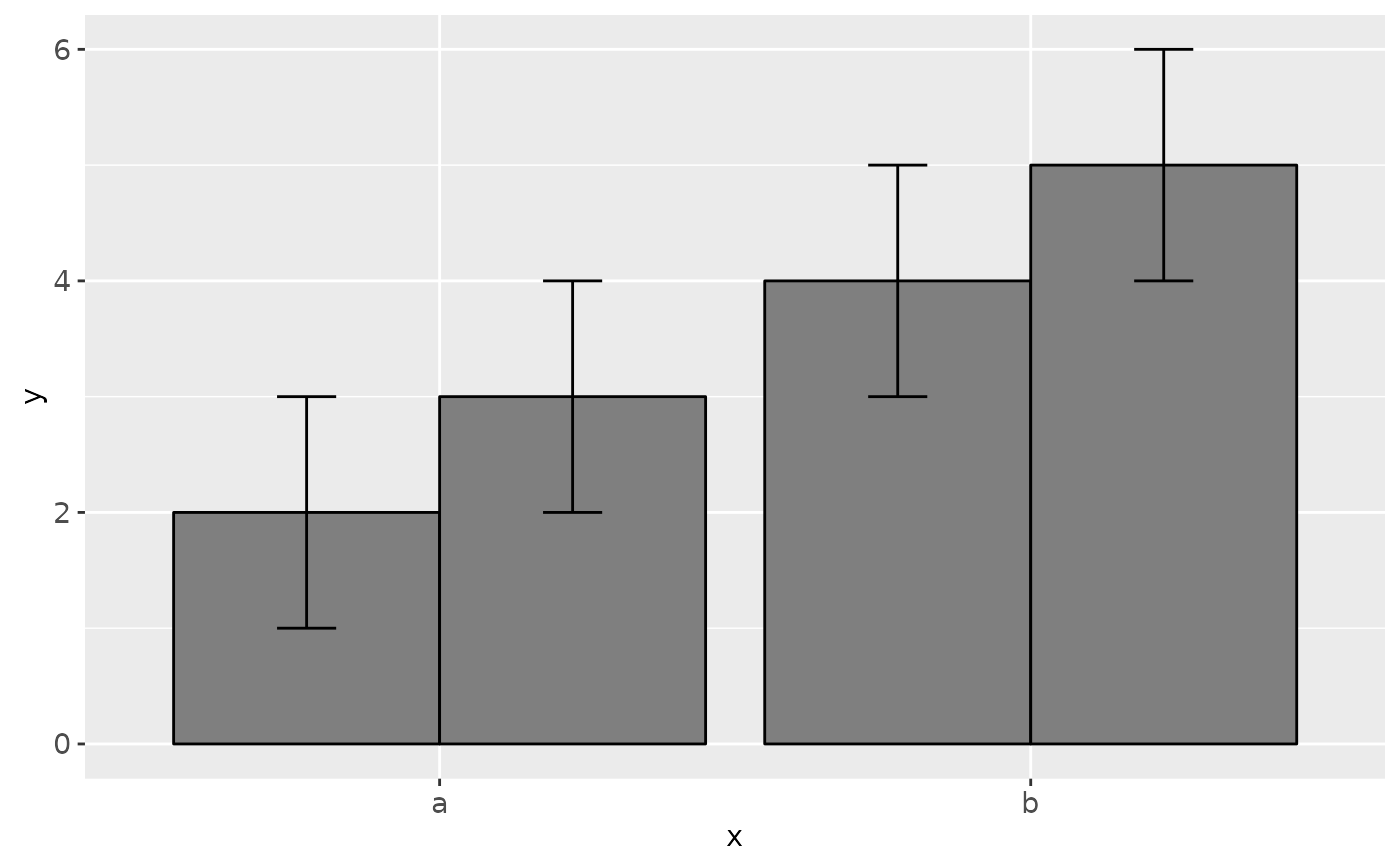
 p + geom_errorbar(aes(ymin = y-1, ymax = y+1, width = 0.2),
position = position_dodge(width = 0.90))
 # }
# }