Based on gray.colors
Usage
scale_colour_grey(..., start = 0.2, end = 0.8, na.value = "red")

scale_fill_grey(..., start = 0.2, end = 0.8, na.value = "red")
Arguments
- ...
Other arguments passed on to
discrete_scaleto control name, limits, breaks, labels and so forth.- start
grey value at low end of palette
- end
grey value at high end of palette
- na.value
Colour to use for missing values
See also
Other colour scales:
scale_colour_brewer,
scale_colour_gradient,
scale_colour_hue
Examples
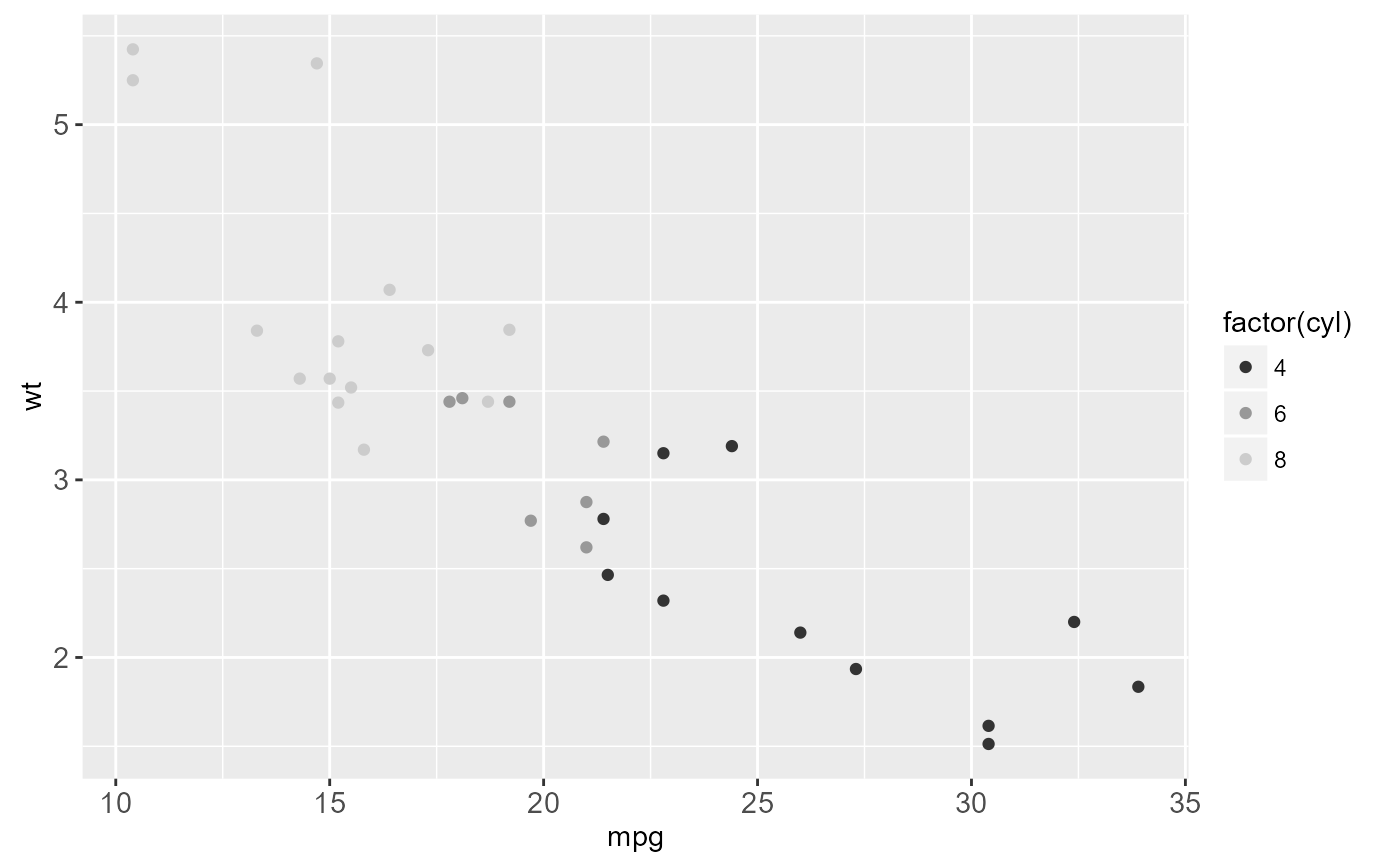
p <- ggplot(mtcars, aes(mpg, wt)) + geom_point(aes(colour = factor(cyl)))
p + scale_colour_grey()
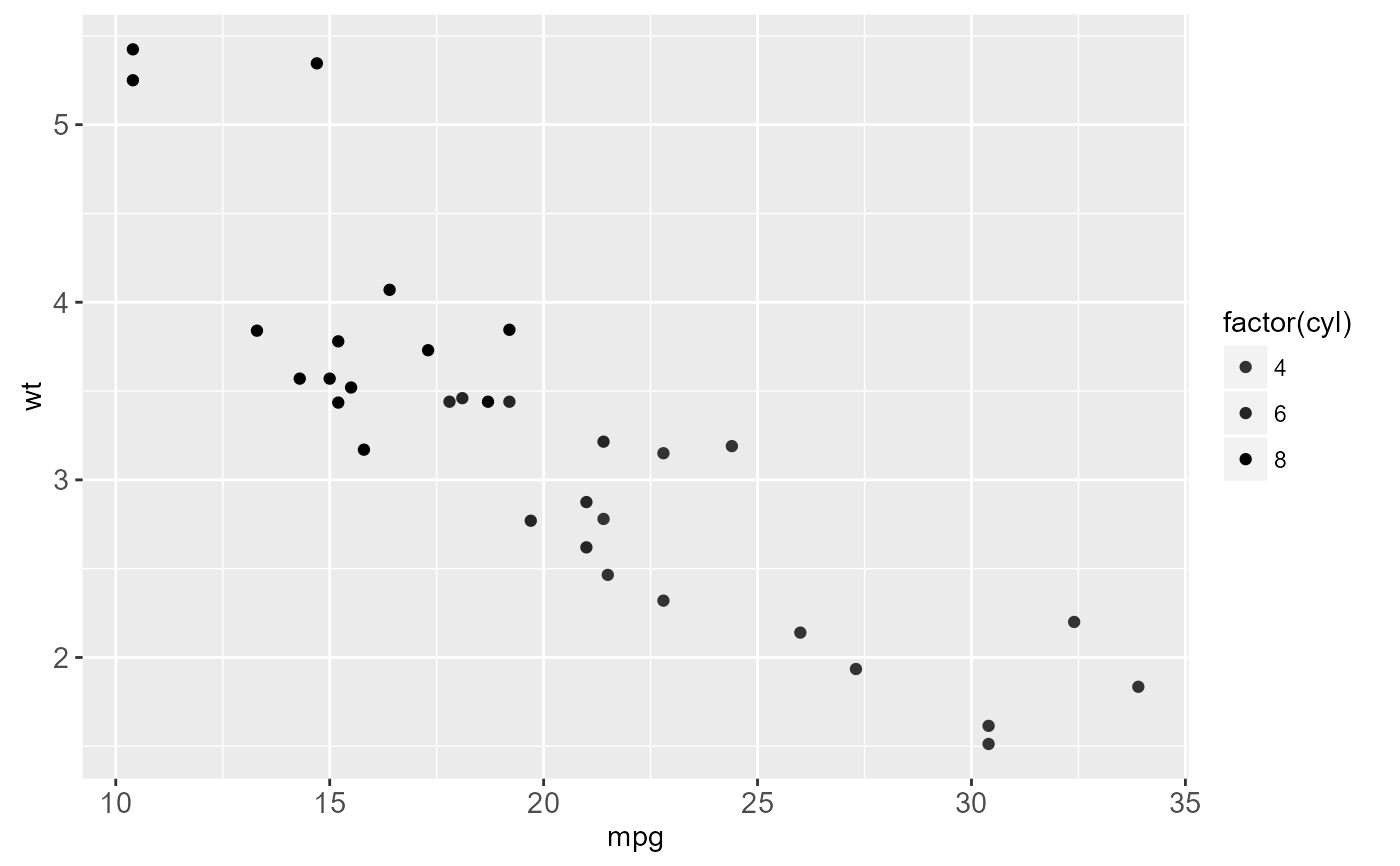
 p + scale_colour_grey(end = 0)
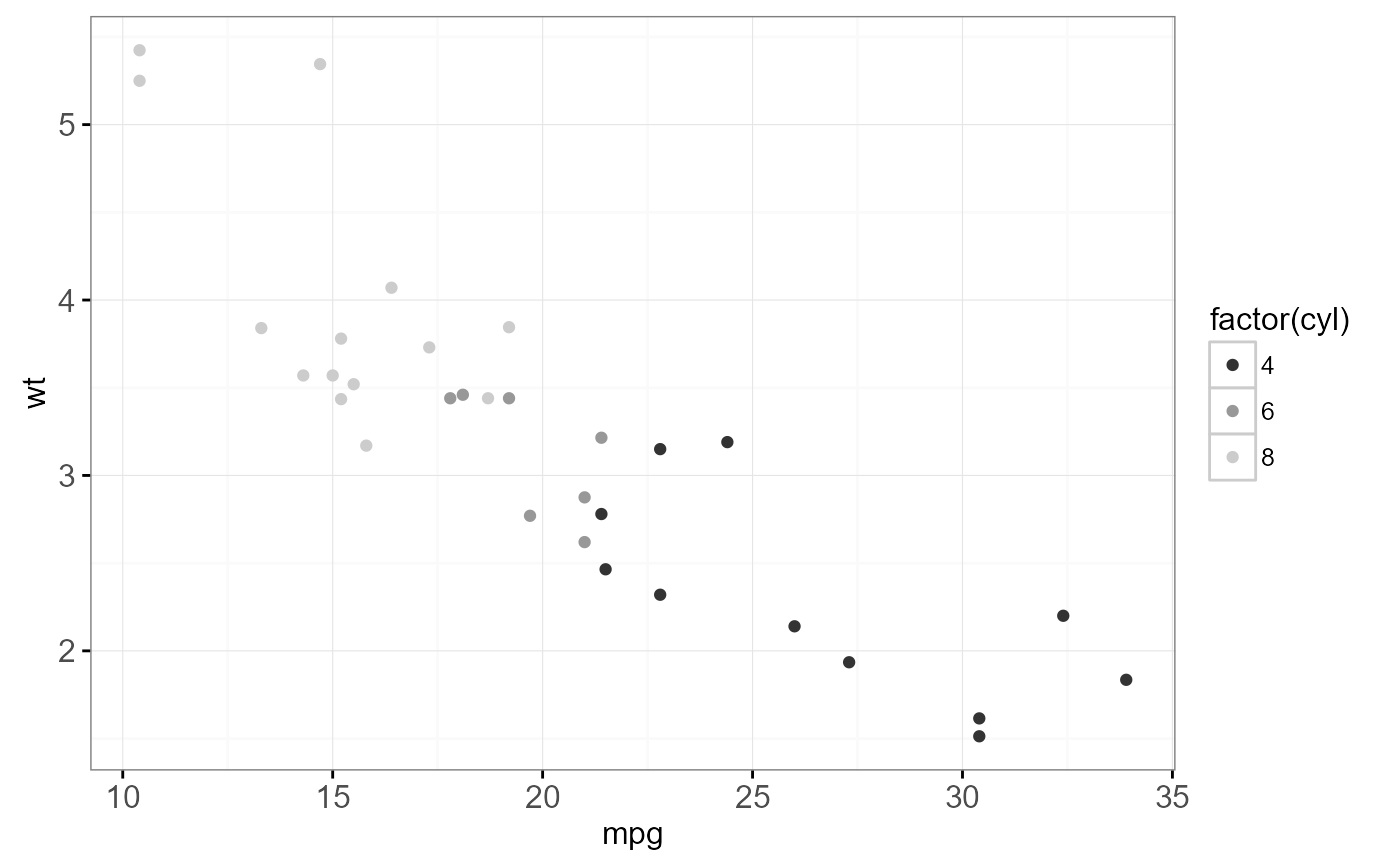
 # You may want to turn off the pale grey background with this scale
p + scale_colour_grey() + theme_bw()
# You may want to turn off the pale grey background with this scale
p + scale_colour_grey() + theme_bw()
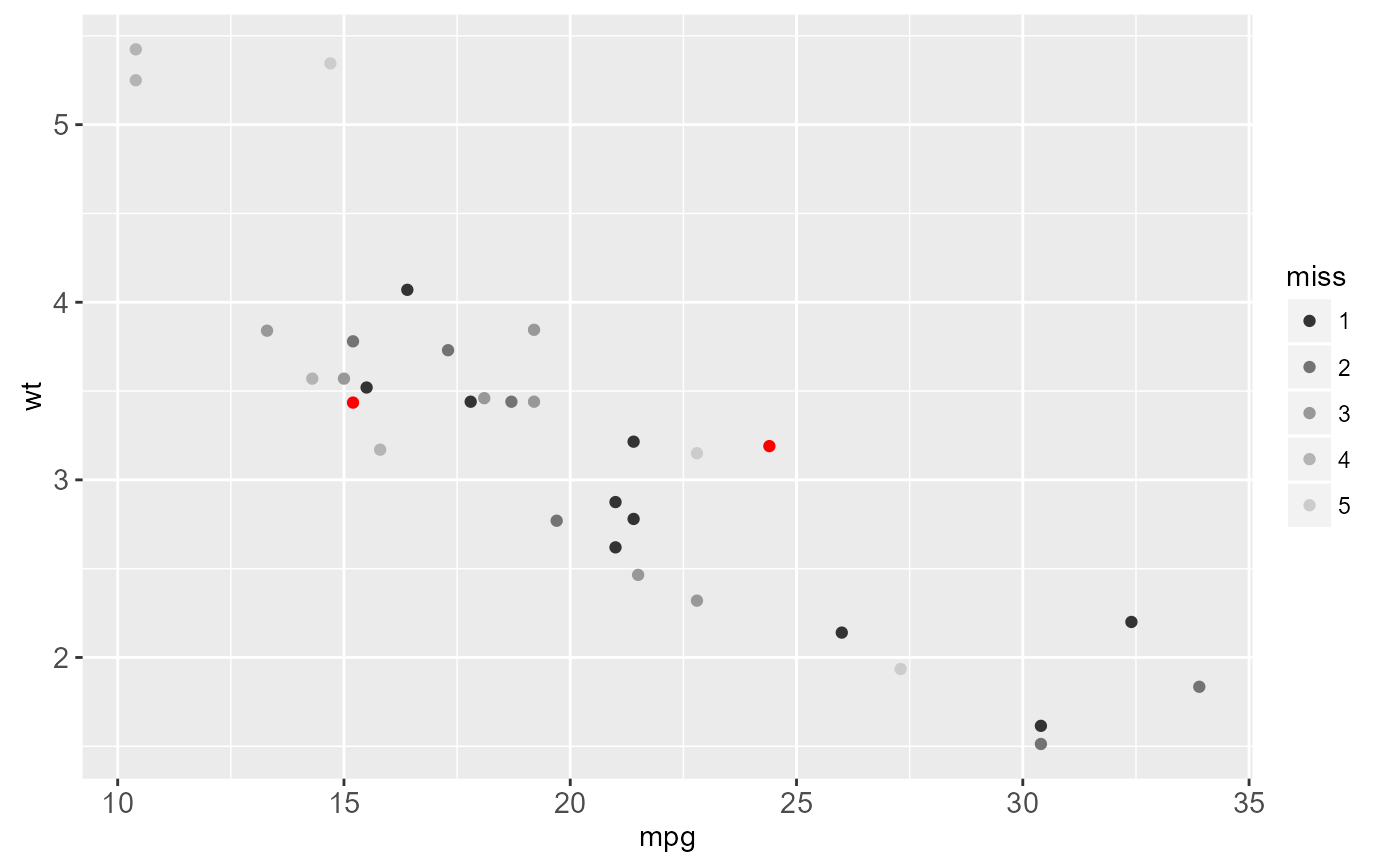
 # Colour of missing values is controlled with na.value:
miss <- factor(sample(c(NA, 1:5), nrow(mtcars), replace = TRUE))
ggplot(mtcars, aes(mpg, wt)) +
geom_point(aes(colour = miss)) +
scale_colour_grey()
# Colour of missing values is controlled with na.value:
miss <- factor(sample(c(NA, 1:5), nrow(mtcars), replace = TRUE))
ggplot(mtcars, aes(mpg, wt)) +
geom_point(aes(colour = miss)) +
scale_colour_grey()
 ggplot(mtcars, aes(mpg, wt)) +
geom_point(aes(colour = miss)) +
scale_colour_grey(na.value = "green")
ggplot(mtcars, aes(mpg, wt)) +
geom_point(aes(colour = miss)) +
scale_colour_grey(na.value = "green")
