Themes set the general aspect of the plot such as the colour of the background, gridlines, the size and colour of fonts.
Usage
theme_grey(base_size = 11, base_family = "")

theme_gray(base_size = 11, base_family = "")

theme_bw(base_size = 12, base_family = "")

theme_linedraw(base_size = 12, base_family = "")

theme_light(base_size = 12, base_family = "")

theme_minimal(base_size = 12, base_family = "")

theme_classic(base_size = 12, base_family = "")

theme_dark(base_size = 12, base_family = "")

theme_void(base_size = 12, base_family = "")Details
theme_grayThe signature ggplot2 theme with a grey background and white gridlines, designed to put the data forward yet make comparisons easy.
theme_bwThe classic dark-on-light ggplot2 theme. May work better for presentations displayed with a projector.
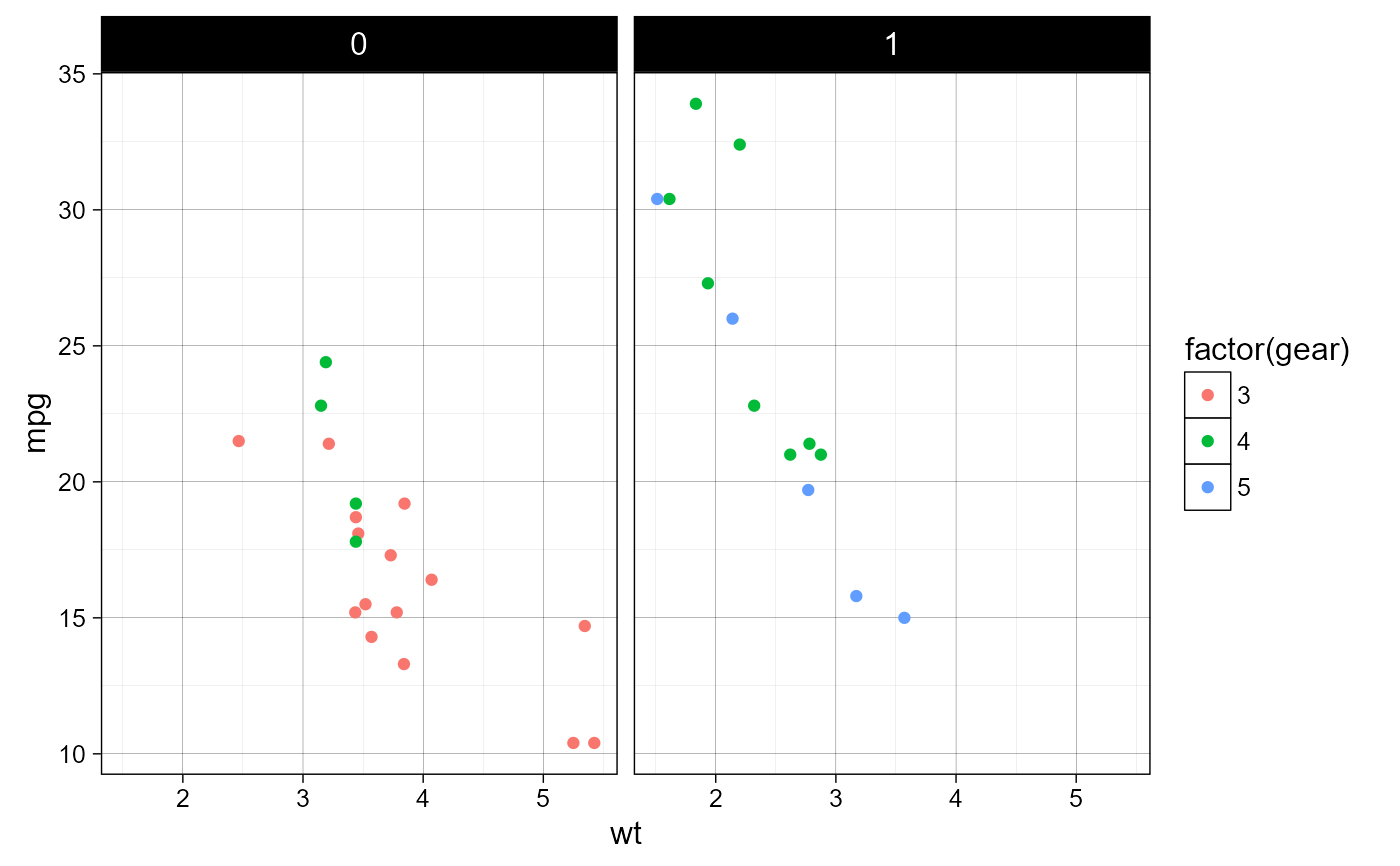
theme_linedrawA theme with only black lines of various widths on white backgrounds, reminiscent of a line drawings. Serves a purpose similar to
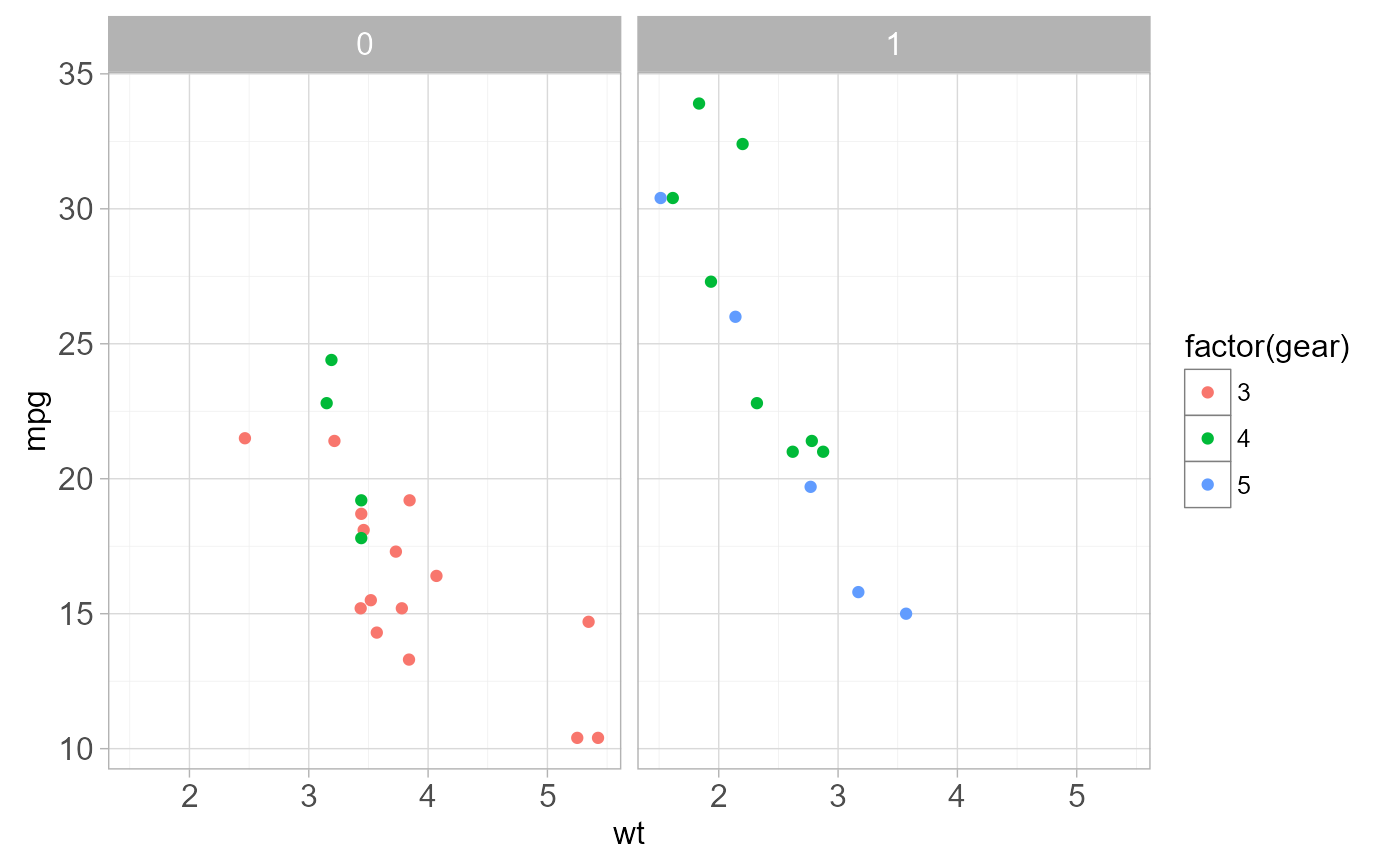
theme_bw. Note that this theme has some very thin lines (<< 1 pt) which some journals may refuse.theme_lightA theme similar to
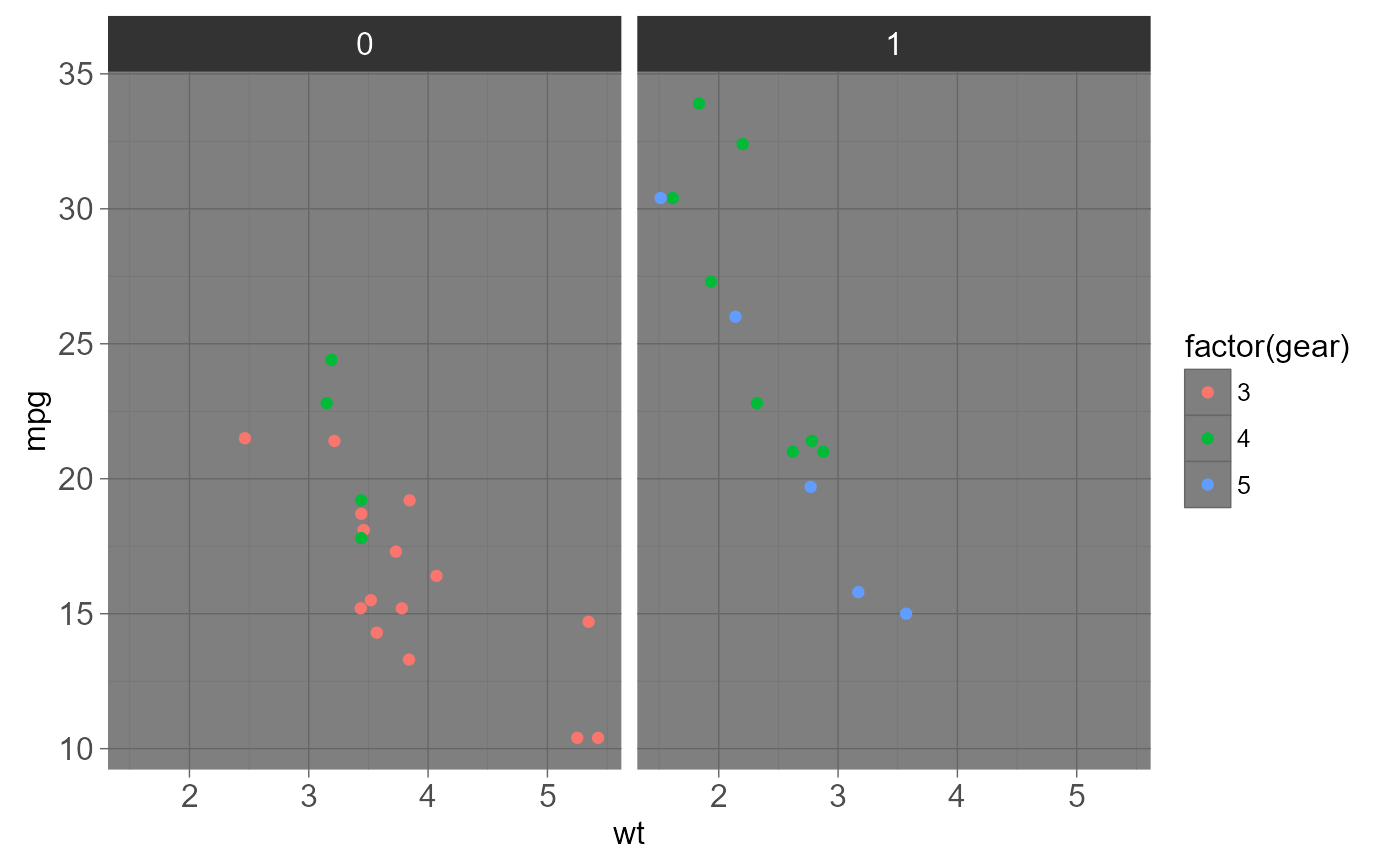
theme_linedrawbut with light grey lines and axes, to direct more attention towards the data.theme_darkThe dark cousin of
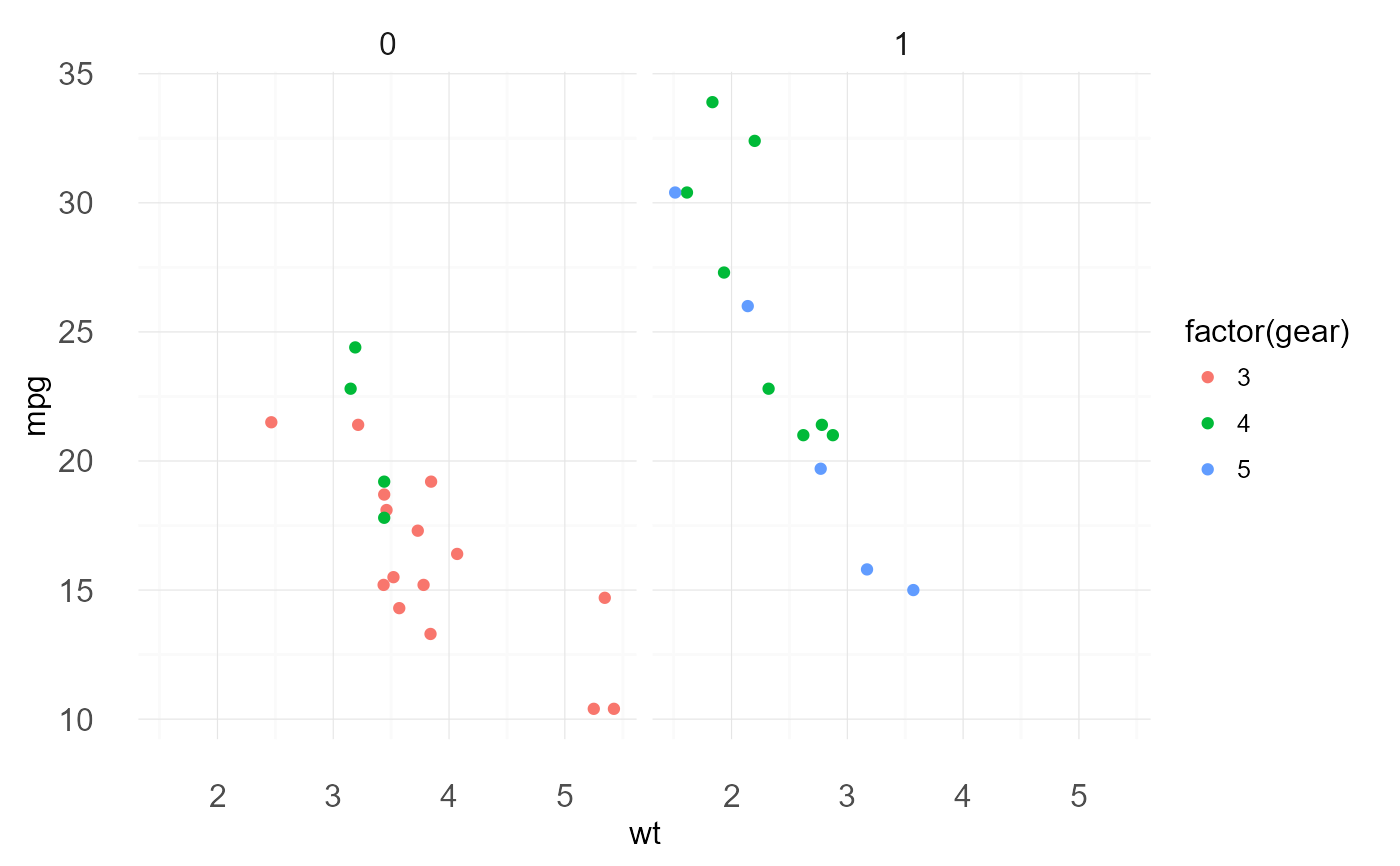
theme_light, with similar line sizes but a dark background. Useful to make thin coloured lines pop out.theme_minimalA minimalistic theme with no background annotations.
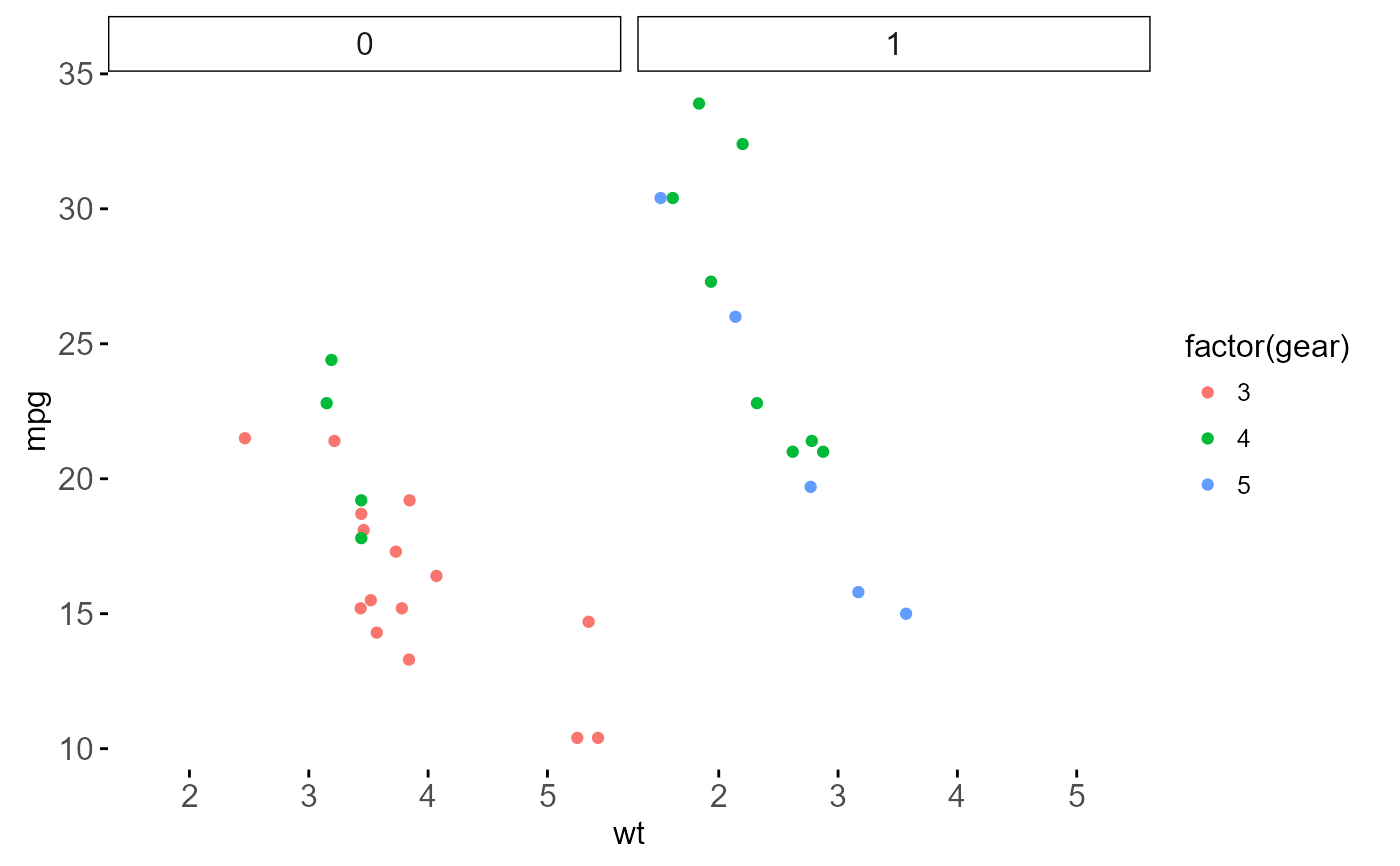
theme_classicA classic-looking theme, with x and y axis lines and no gridlines.
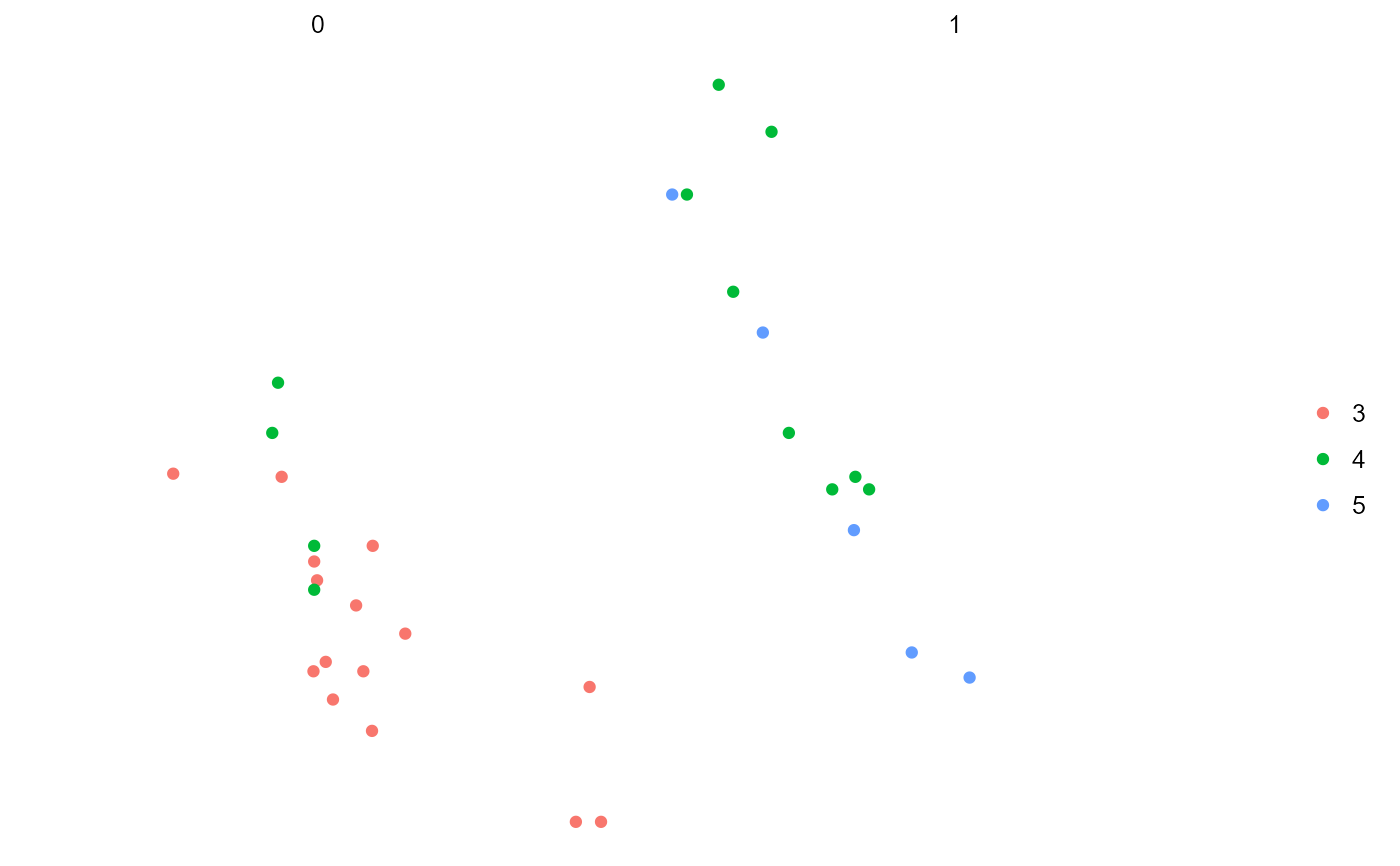
theme_voidA completely empty theme.
Examples
p <- ggplot(mtcars) + geom_point(aes(x = wt, y = mpg,
colour = factor(gear))) + facet_wrap(~am)
p
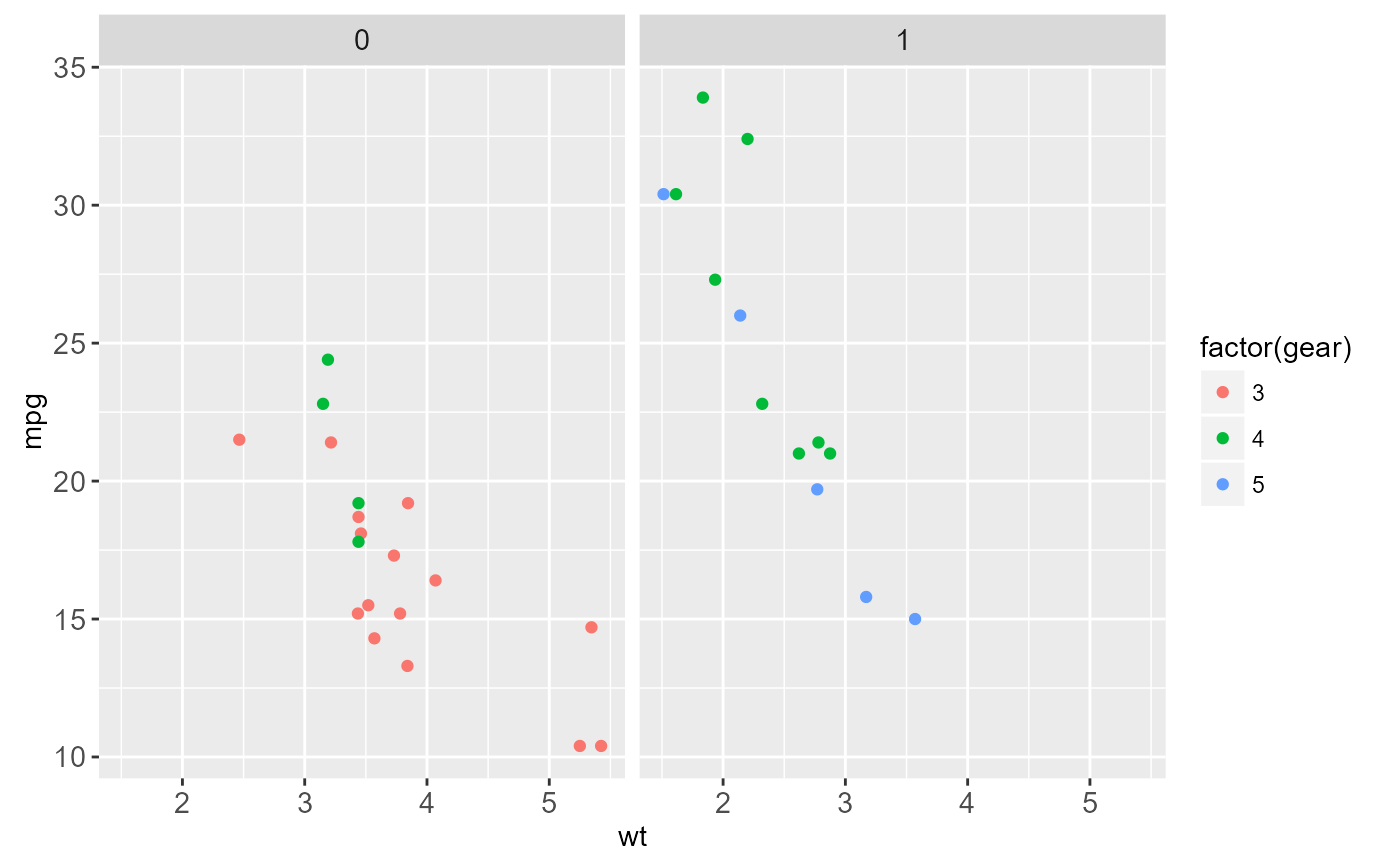 p + theme_gray()
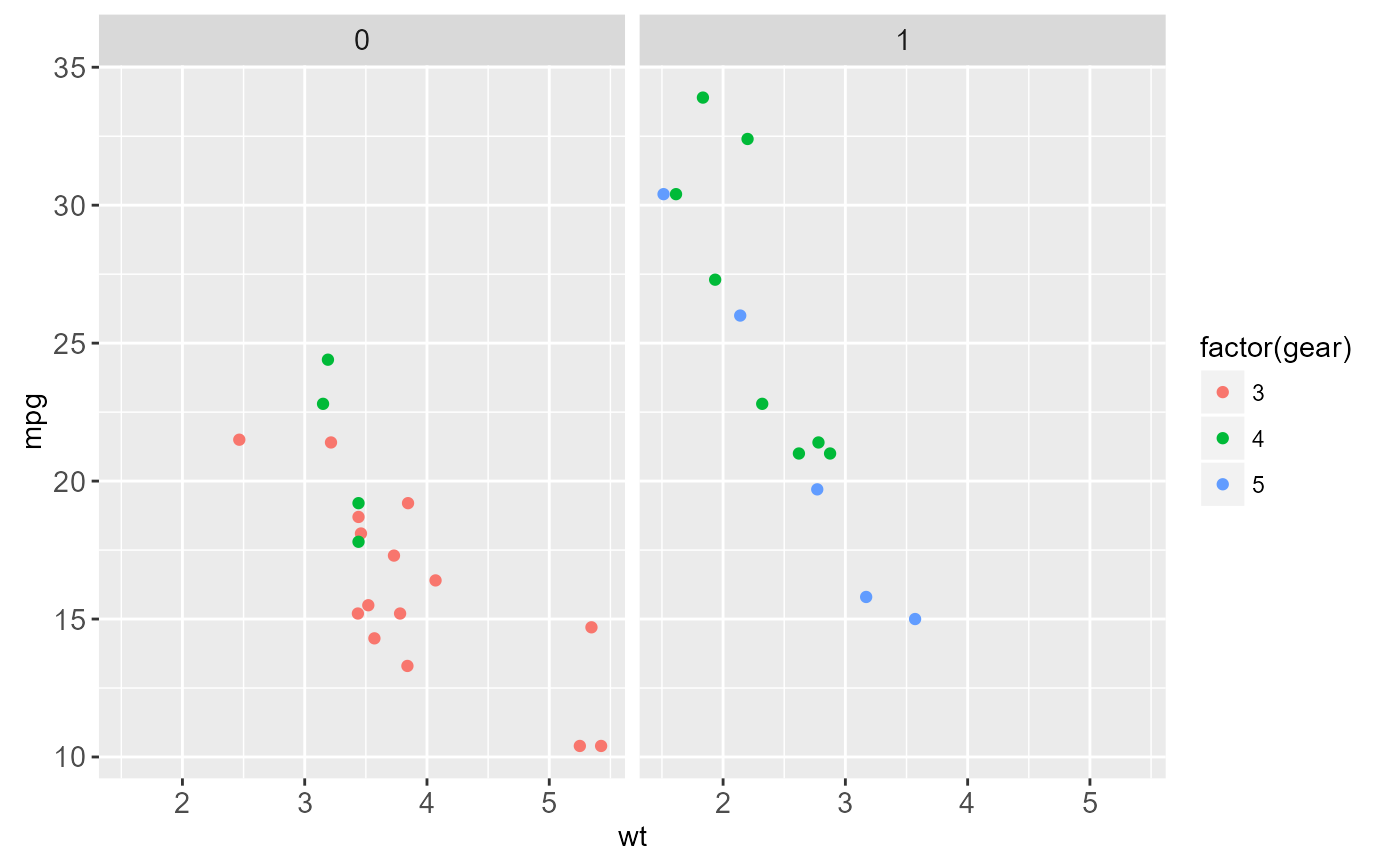 p + theme_bw()
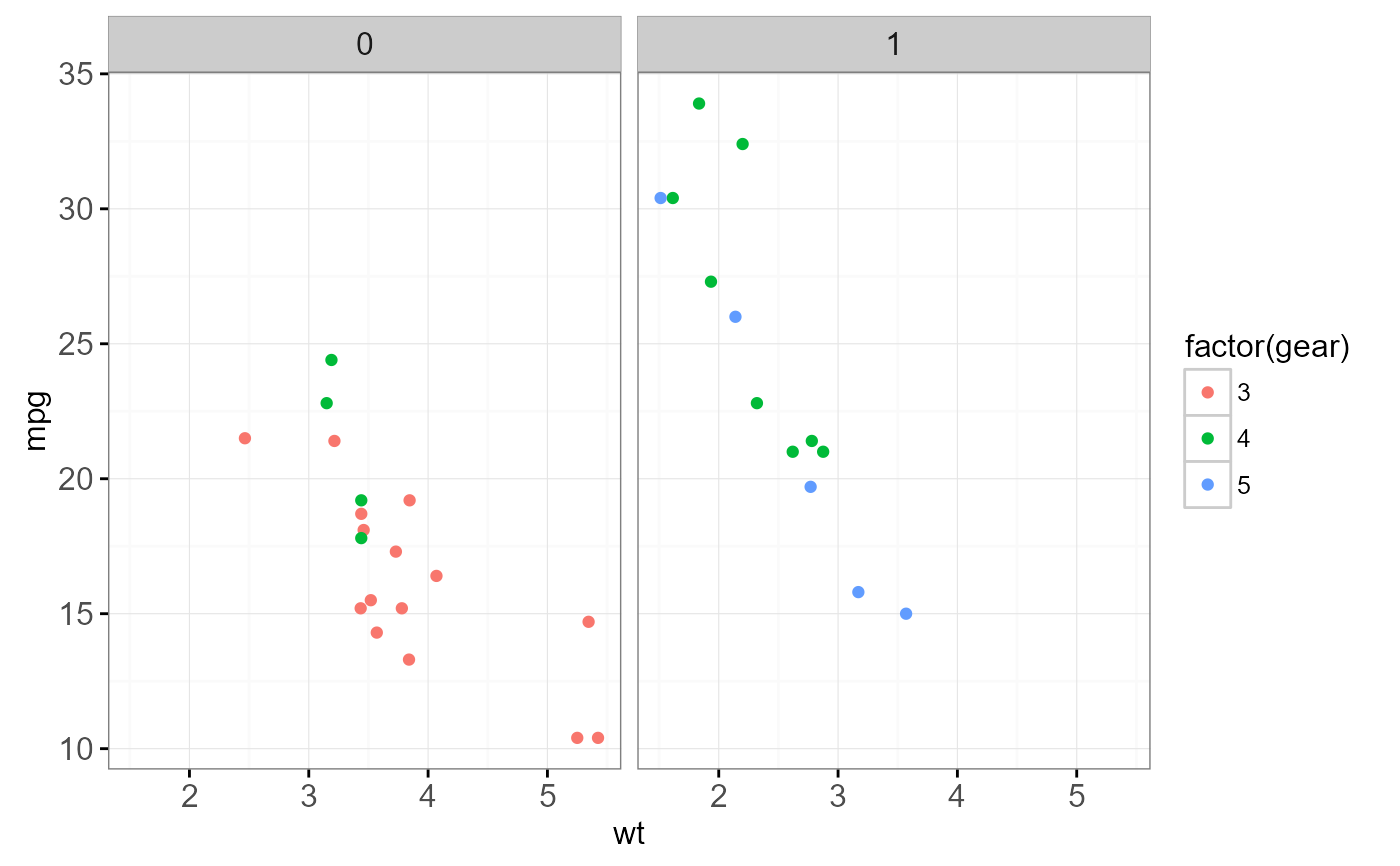 p + theme_linedraw()
 p + theme_light()
 p + theme_dark()
 p + theme_minimal()
 p + theme_classic()
 p + theme_void()
