geom_segment draws a straight line between points (x1, y1) and
(x2, y2). geom_curve draws a curved line.
Usage
geom_segment(
  mapping = NULL,
  data = NULL,
  stat = "identity",
  position = "identity",
  ...,
  arrow = NULL,
  lineend = "butt",
  na.rm = FALSE,
  show.legend = NA,
  inherit.aes = TRUE
)

geom_curve(
  mapping = NULL,
  data = NULL,
  stat = "identity",
  position = "identity",
  ...,
  curvature = 0.5,
  angle = 90,
  ncp = 5,
  arrow = NULL,
  lineend = "butt",
  na.rm = FALSE,
  show.legend = NA,
  inherit.aes = TRUE
)
Arguments
- mapping
Set of aesthetic mappings created by
aesoraes_. If specified andinherit.aes = TRUE(the default), it is combined with the default mapping at the top level of the plot. You must supplymappingif there is no plot mapping.- data
The data to be displayed in this layer. There are three options:
If
NULL, the default, the data is inherited from the plot data as specified in the call toggplot.A
data.frame, or other object, will override the plot data. All objects will be fortified to produce a data frame. Seefortifyfor which variables will be created.A
functionwill be called with a single argument, the plot data. The return value must be adata.frame., and will be used as the layer data.- stat
The statistical transformation to use on the data for this layer, as a string.
- position
Position adjustment, either as a string, or the result of a call to a position adjustment function.
- ...
other arguments passed on to
layer. These are often aesthetics, used to set an aesthetic to a fixed value, likecolor = "red"orsize = 3. They may also be parameters to the paired geom/stat.- arrow
specification for arrow heads, as created by arrow()
- lineend
Line end style (round, butt, square)
- na.rm
If
FALSE(the default), removes missing values with a warning. IfTRUEsilently removes missing values.- show.legend
logical. Should this layer be included in the legends?
NA, the default, includes if any aesthetics are mapped.FALSEnever includes, andTRUEalways includes.- inherit.aes
If
FALSE, overrides the default aesthetics, rather than combining with them. This is most useful for helper functions that define both data and aesthetics and shouldn't inherit behaviour from the default plot specification, e.g.borders.- curvature
A numeric value giving the amount of curvature. Negative values produce left-hand curves, positive values produce right-hand curves, and zero produces a straight line.
- angle
A numeric value between 0 and 180, giving an amount to skew the control points of the curve. Values less than 90 skew the curve towards the start point and values greater than 90 skew the curve towards the end point.
- ncp
The number of control points used to draw the curve. More control points creates a smoother curve.
Aesthetics
geom_segment understands the following aesthetics (required aesthetics are in bold):
x
xend
y
yend
alpha
colour
linetype
size
See also
geom_path and geom_line for multi-
segment lines and paths.
geom_spoke for a segment parameterised by a location
(x, y), and an angle and radius.
Examples
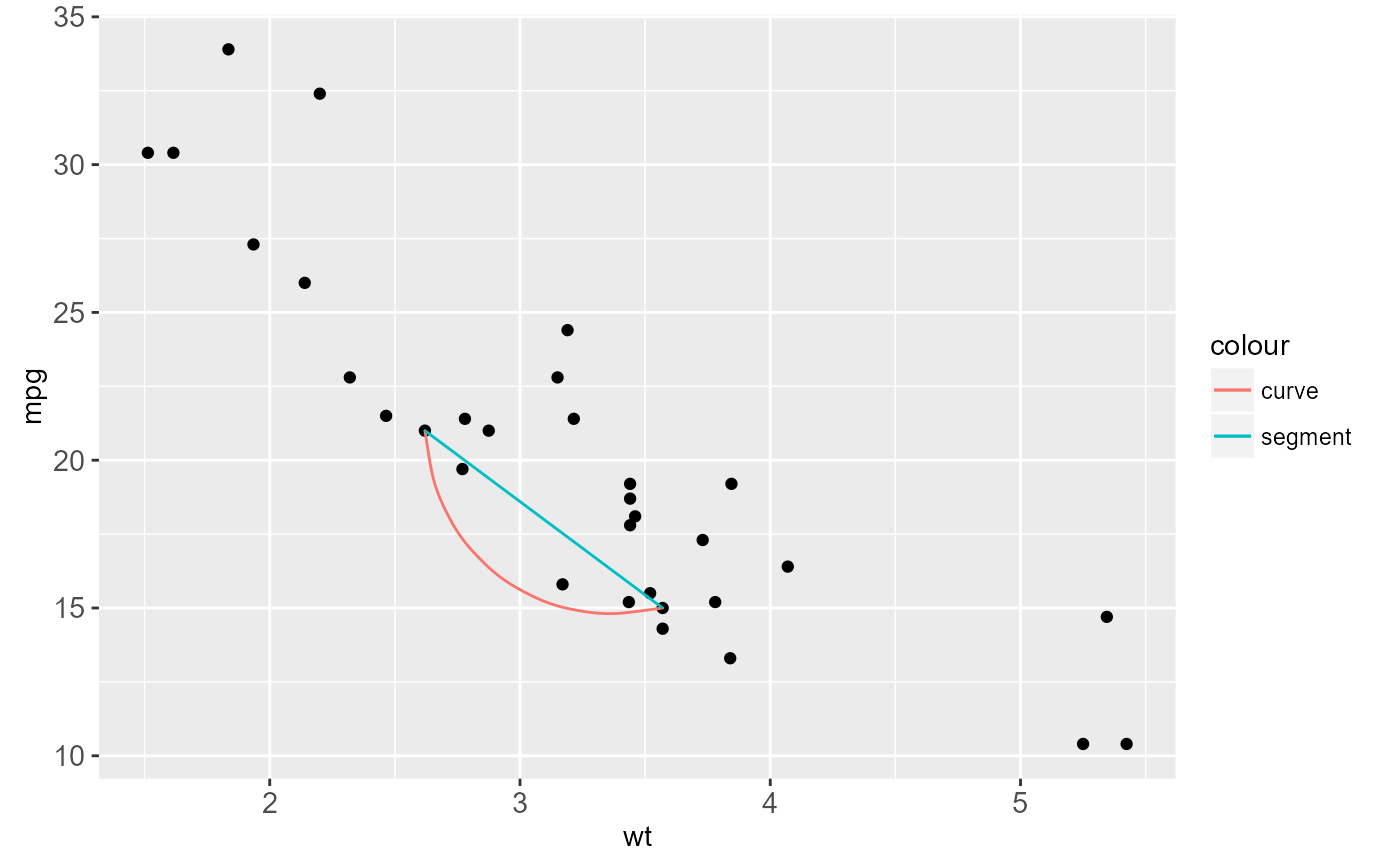
b <- ggplot(mtcars, aes(wt, mpg)) +
geom_point()
df <- data.frame(x1 = 2.62, x2 = 3.57, y1 = 21.0, y2 = 15.0)
b +
geom_curve(aes(x = x1, y = y1, xend = x2, yend = y2, colour = "curve"), data = df) +
geom_segment(aes(x = x1, y = y1, xend = x2, yend = y2, colour = "segment"), data = df)
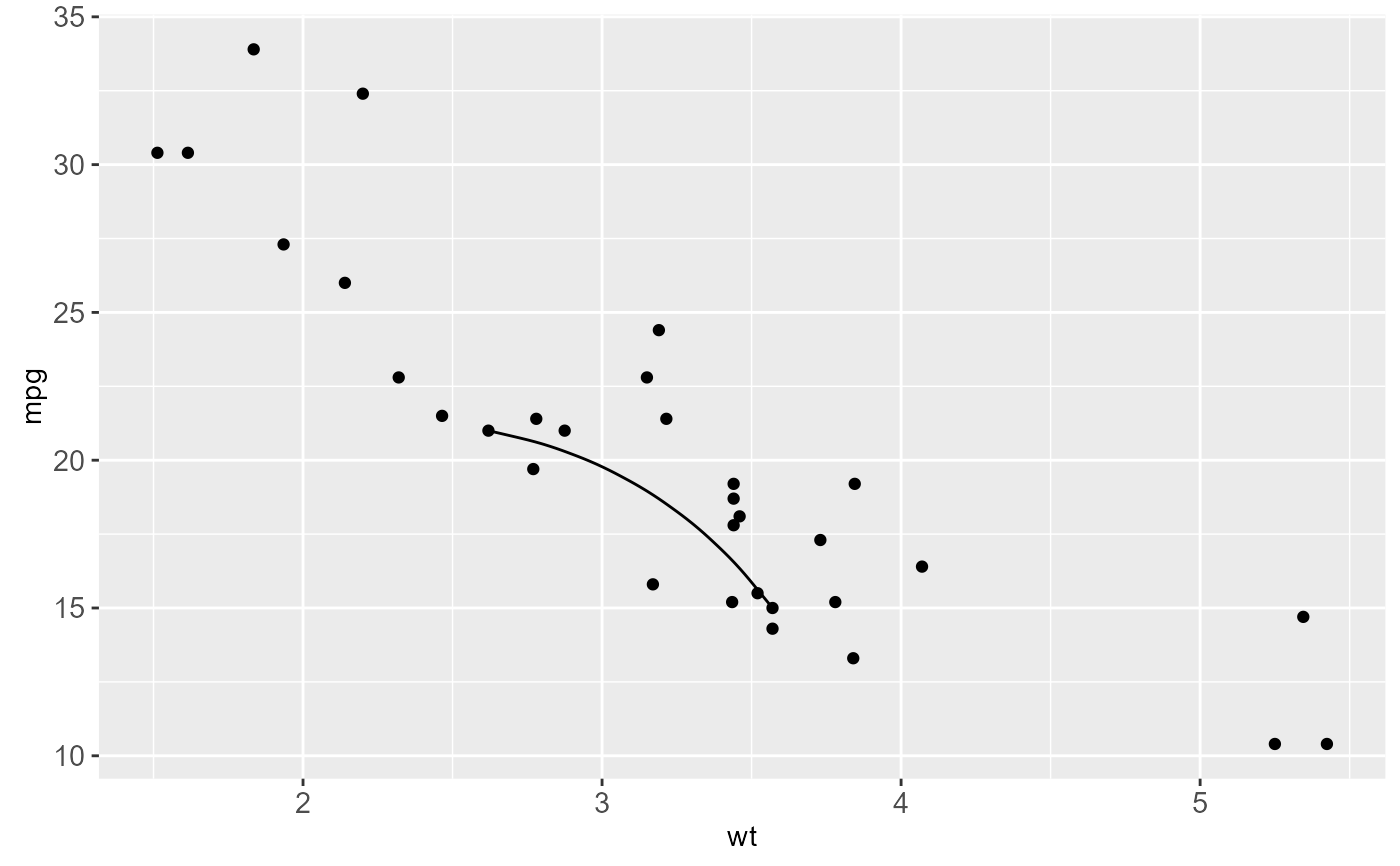
 b + geom_curve(aes(x = x1, y = y1, xend = x2, yend = y2), data = df, curvature = -0.2)
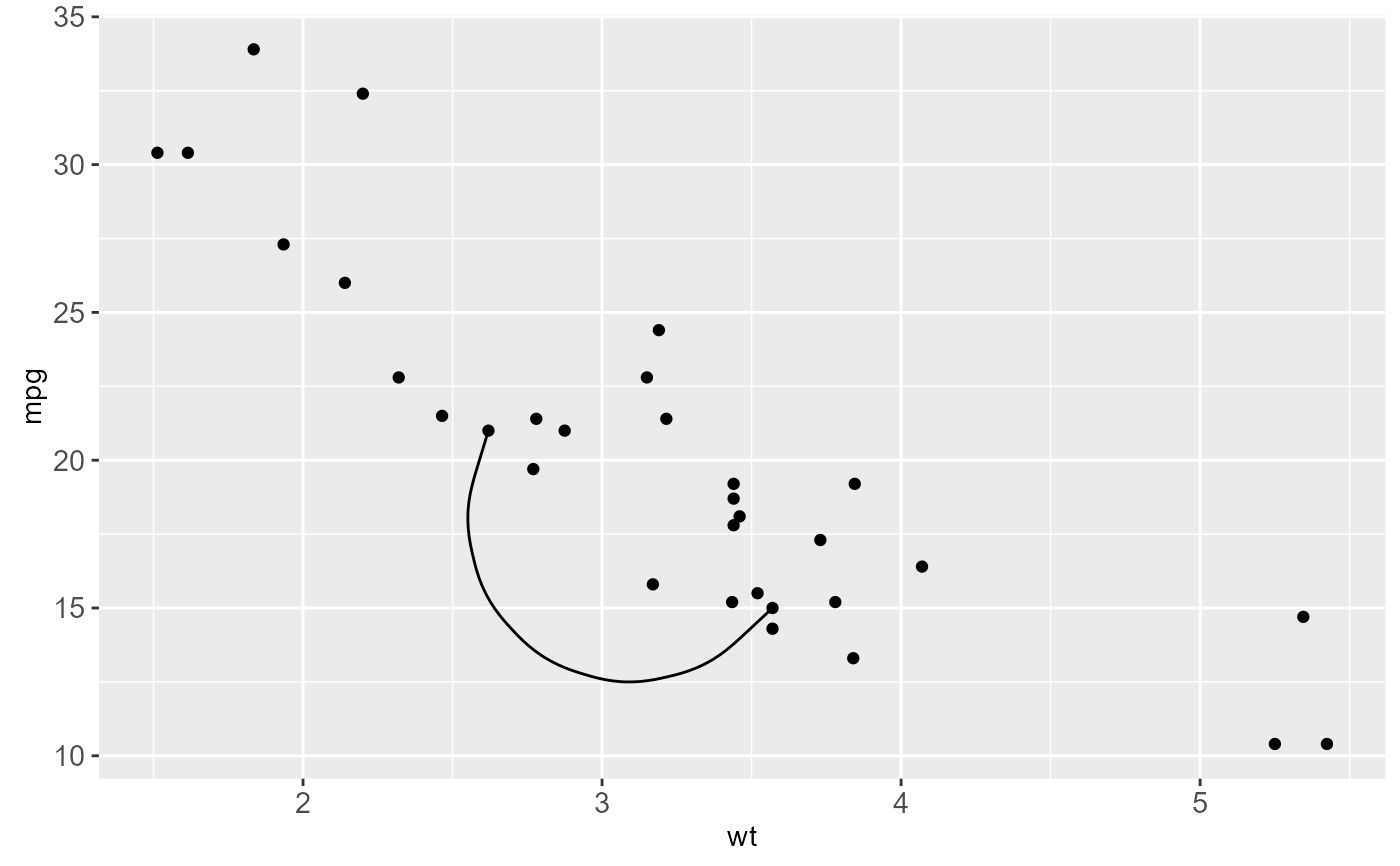
 b + geom_curve(aes(x = x1, y = y1, xend = x2, yend = y2), data = df, curvature = 1)
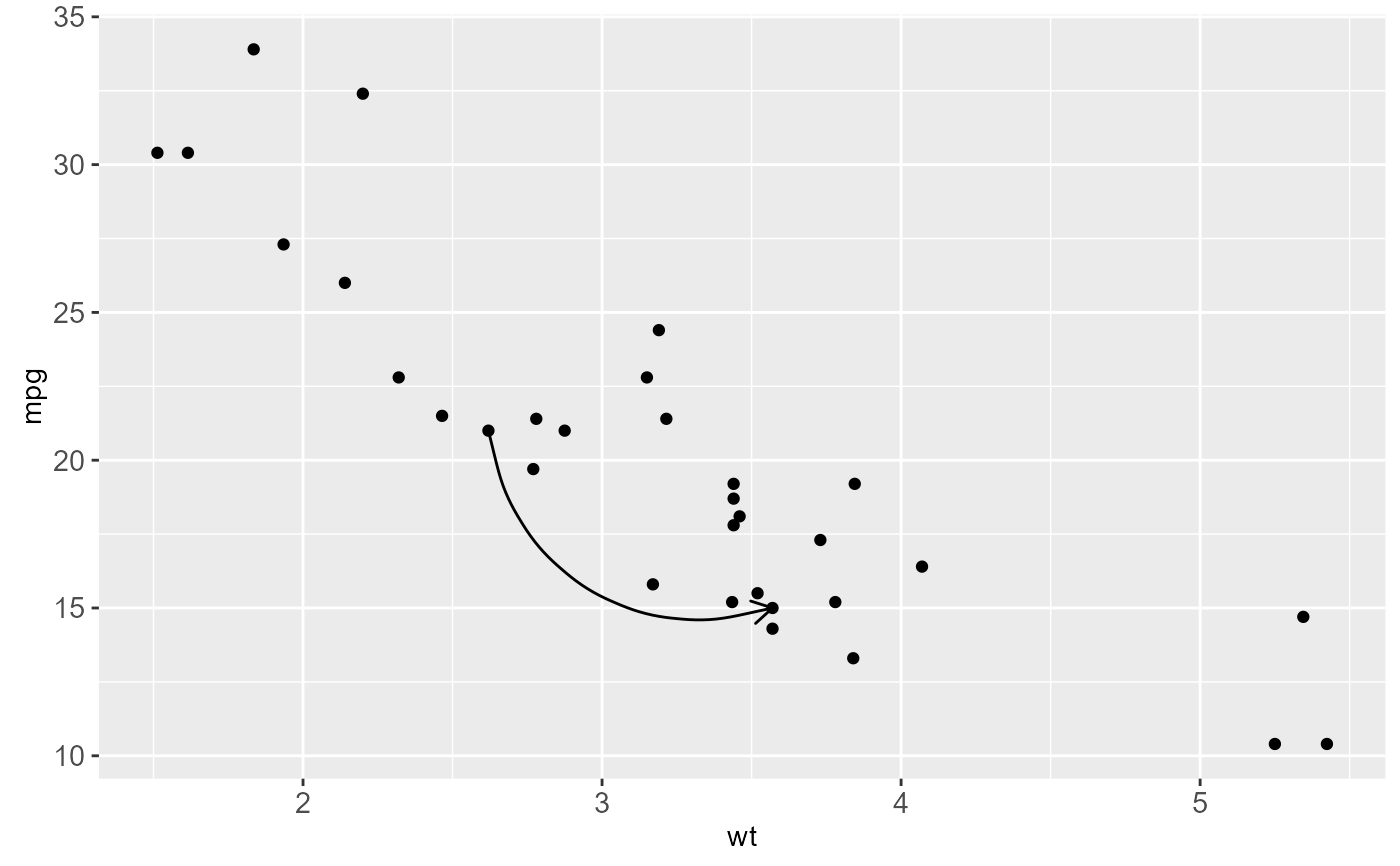
 b + geom_curve(
aes(x = x1, y = y1, xend = x2, yend = y2),
data = df,
arrow = arrow(length = unit(0.03, "npc"))
)
b + geom_curve(
aes(x = x1, y = y1, xend = x2, yend = y2),
data = df,
arrow = arrow(length = unit(0.03, "npc"))
)
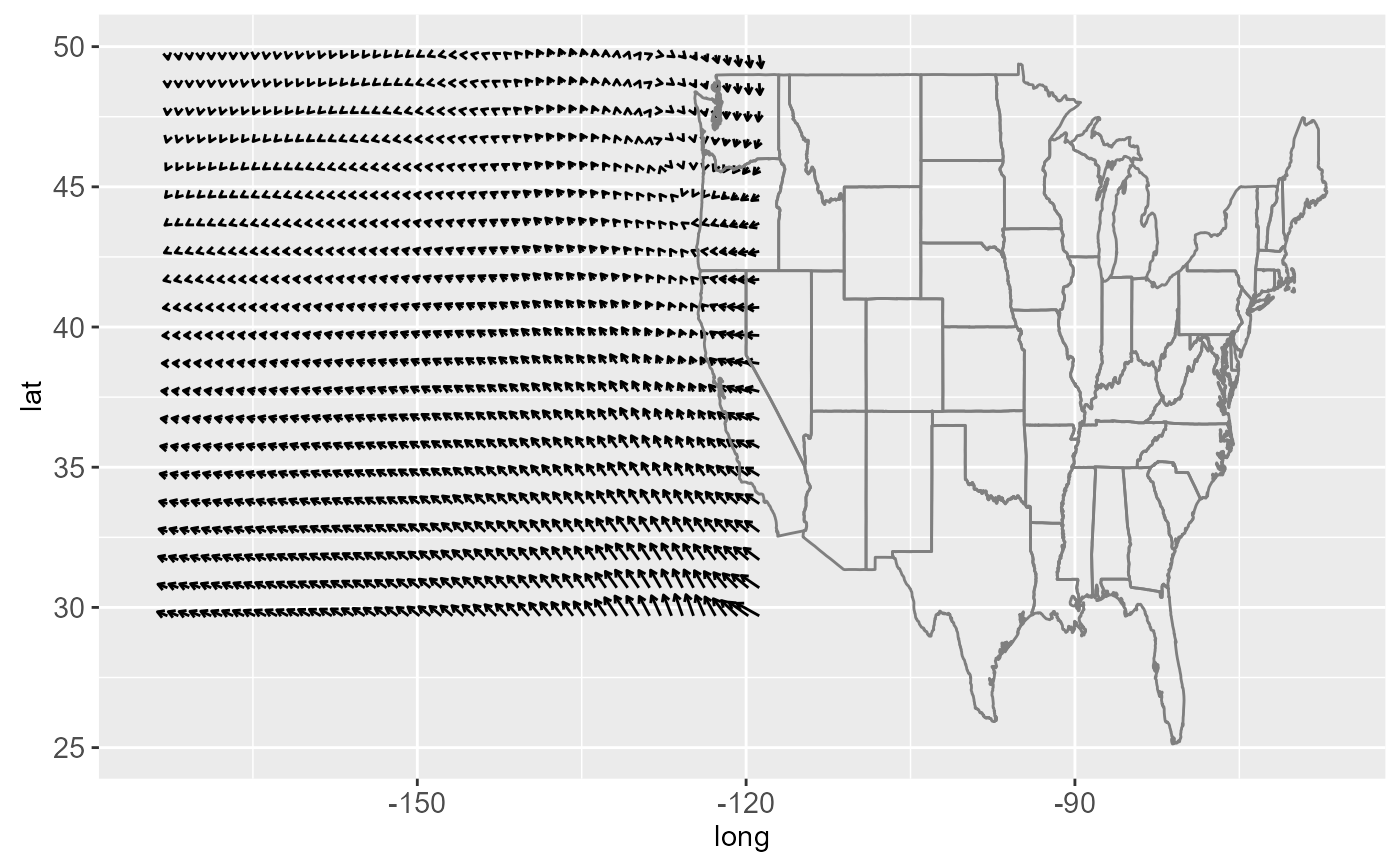
 ggplot(seals, aes(long, lat)) +
geom_segment(aes(xend = long + delta_long, yend = lat + delta_lat),
arrow = arrow(length = unit(0.1,"cm"))) +
borders("state")
ggplot(seals, aes(long, lat)) +
geom_segment(aes(xend = long + delta_long, yend = lat + delta_lat),
arrow = arrow(length = unit(0.1,"cm"))) +
borders("state")
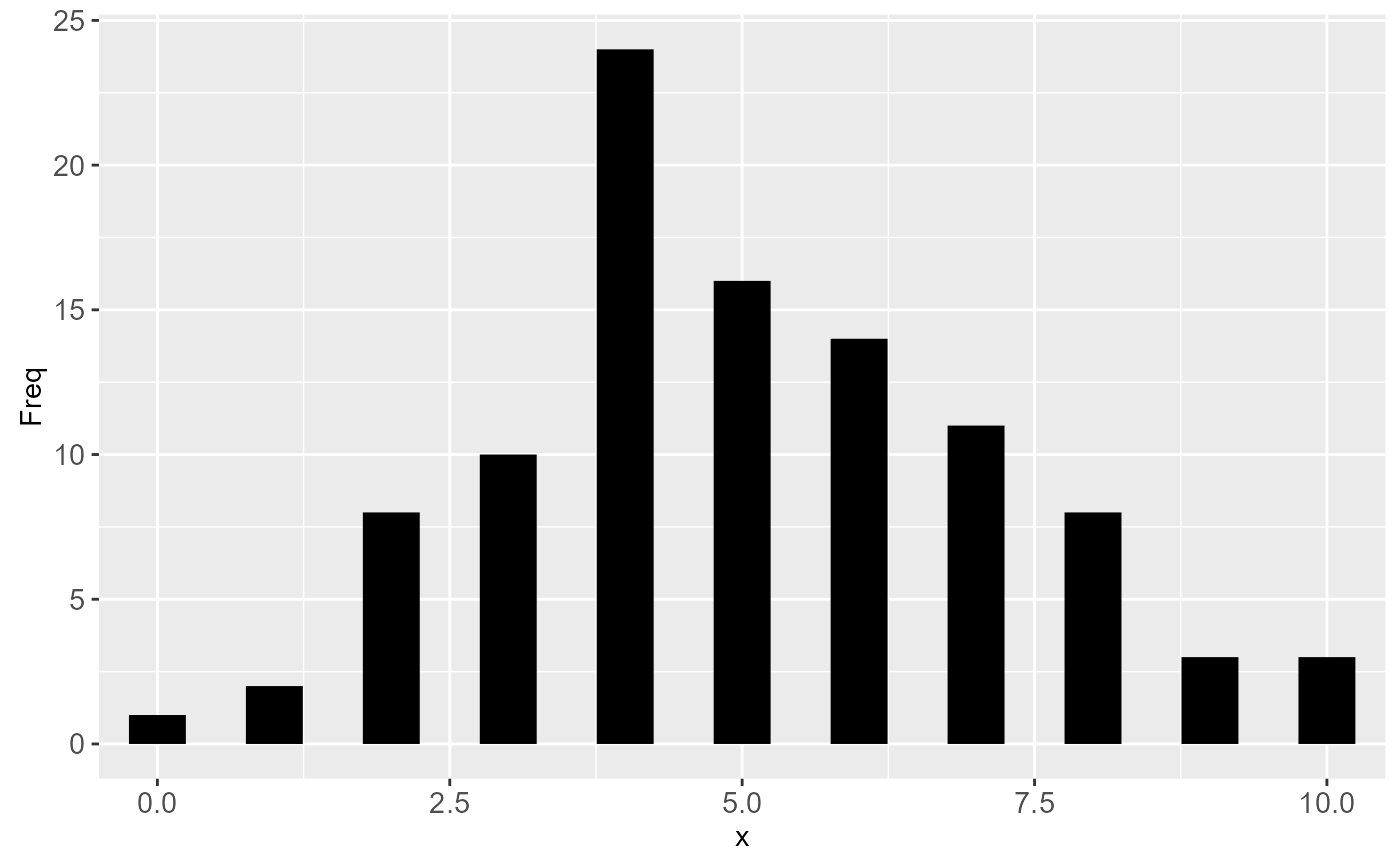
 # You can also use geom_segment to recreate plot(type = "h") :
counts <- as.data.frame(table(x = rpois(100,5)))
counts$x <- as.numeric(as.character(counts$x))
with(counts, plot(x, Freq, type = "h", lwd = 10))
# You can also use geom_segment to recreate plot(type = "h") :
counts <- as.data.frame(table(x = rpois(100,5)))
counts$x <- as.numeric(as.character(counts$x))
with(counts, plot(x, Freq, type = "h", lwd = 10))
 ggplot(counts, aes(x, Freq)) +
geom_segment(aes(xend = x, yend = 0), size = 10, lineend = "butt")
ggplot(counts, aes(x, Freq)) +
geom_segment(aes(xend = x, yend = 0), size = 10, lineend = "butt")