A layer is a combination of data, stat and geom with a potential position
adjustment. Usually layers are created using geom_* or stat_*
calls but it can also be created directly using this function.
Usage
layer(
  geom = NULL,
  stat = NULL,
  data = NULL,
  mapping = NULL,
  position = NULL,
  params = list(),
  inherit.aes = TRUE,
  subset = NULL,
  show.legend = NA
)
Arguments
- geom
The geometric object to use display the data
- stat
The statistical transformation to use on the data for this layer, as a string.
- data
The data to be displayed in this layer. There are three options:
If
NULL, the default, the data is inherited from the plot data as specified in the call toggplot.A
data.frame, or other object, will override the plot data. All objects will be fortified to produce a data frame. Seefortifyfor which variables will be created.A
functionwill be called with a single argument, the plot data. The return value must be adata.frame., and will be used as the layer data.- mapping
Set of aesthetic mappings created by
aesoraes_. If specified andinherit.aes = TRUE(the default), it is combined with the default mapping at the top level of the plot. You must supplymappingif there is no plot mapping.- position
Position adjustment, either as a string, or the result of a call to a position adjustment function.
- params
Additional parameters to the
geomandstat.- inherit.aes
If
FALSE, overrides the default aesthetics, rather than combining with them. This is most useful for helper functions that define both data and aesthetics and shouldn't inherit behaviour from the default plot specification, e.g.borders.- subset
DEPRECATED. An older way of subsetting the dataset used in a layer.
- show.legend
logical. Should this layer be included in the legends?
NA, the default, includes if any aesthetics are mapped.FALSEnever includes, andTRUEalways includes.
Examples
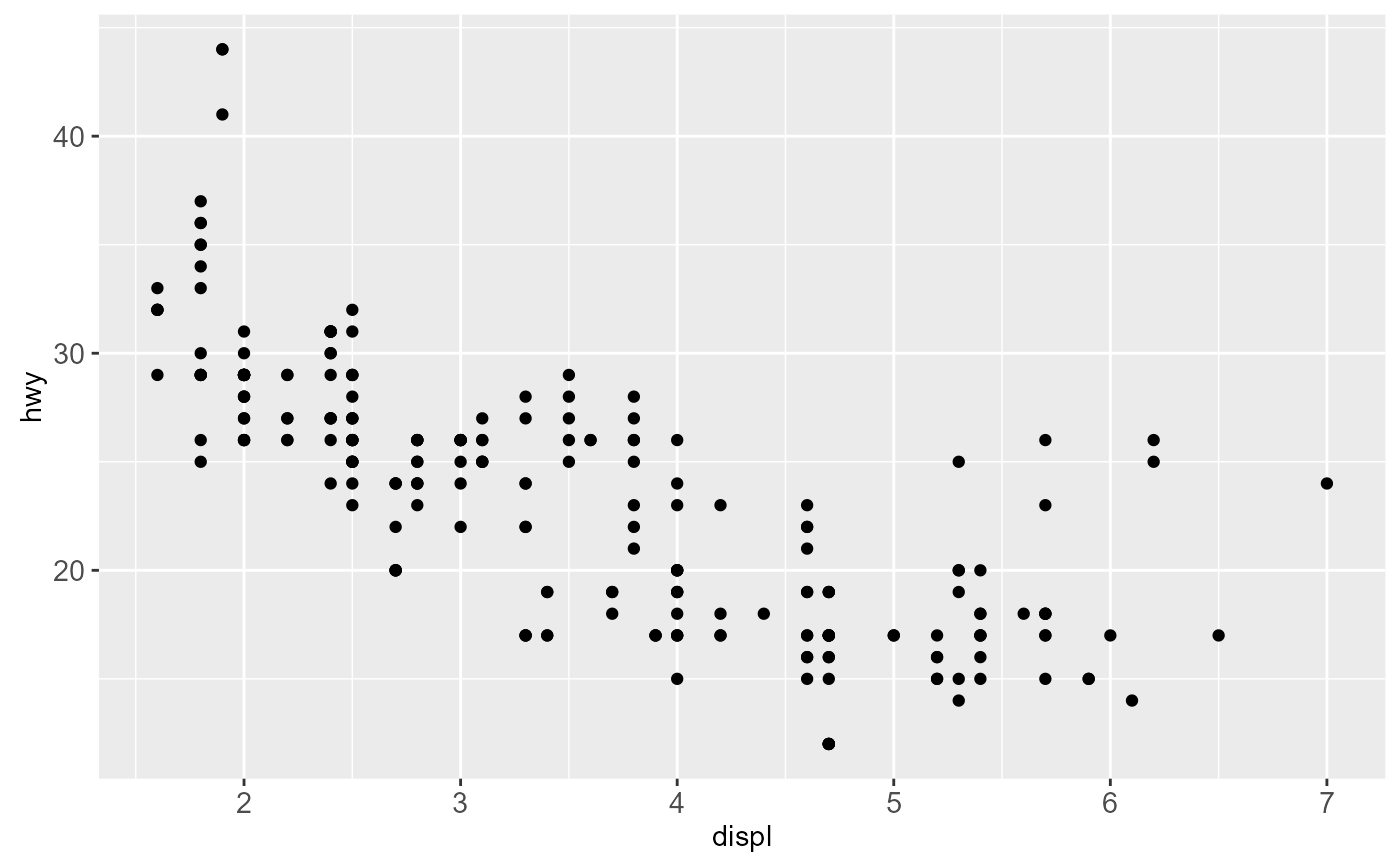
# geom calls are just a short cut for layer
ggplot(mpg, aes(displ, hwy)) + geom_point()
 # shortcut for
ggplot(mpg, aes(displ, hwy)) +
layer(geom = "point", stat = "identity", position = "identity",
params = list(na.rm = FALSE)
)
# shortcut for
ggplot(mpg, aes(displ, hwy)) +
layer(geom = "point", stat = "identity", position = "identity",
params = list(na.rm = FALSE)
)
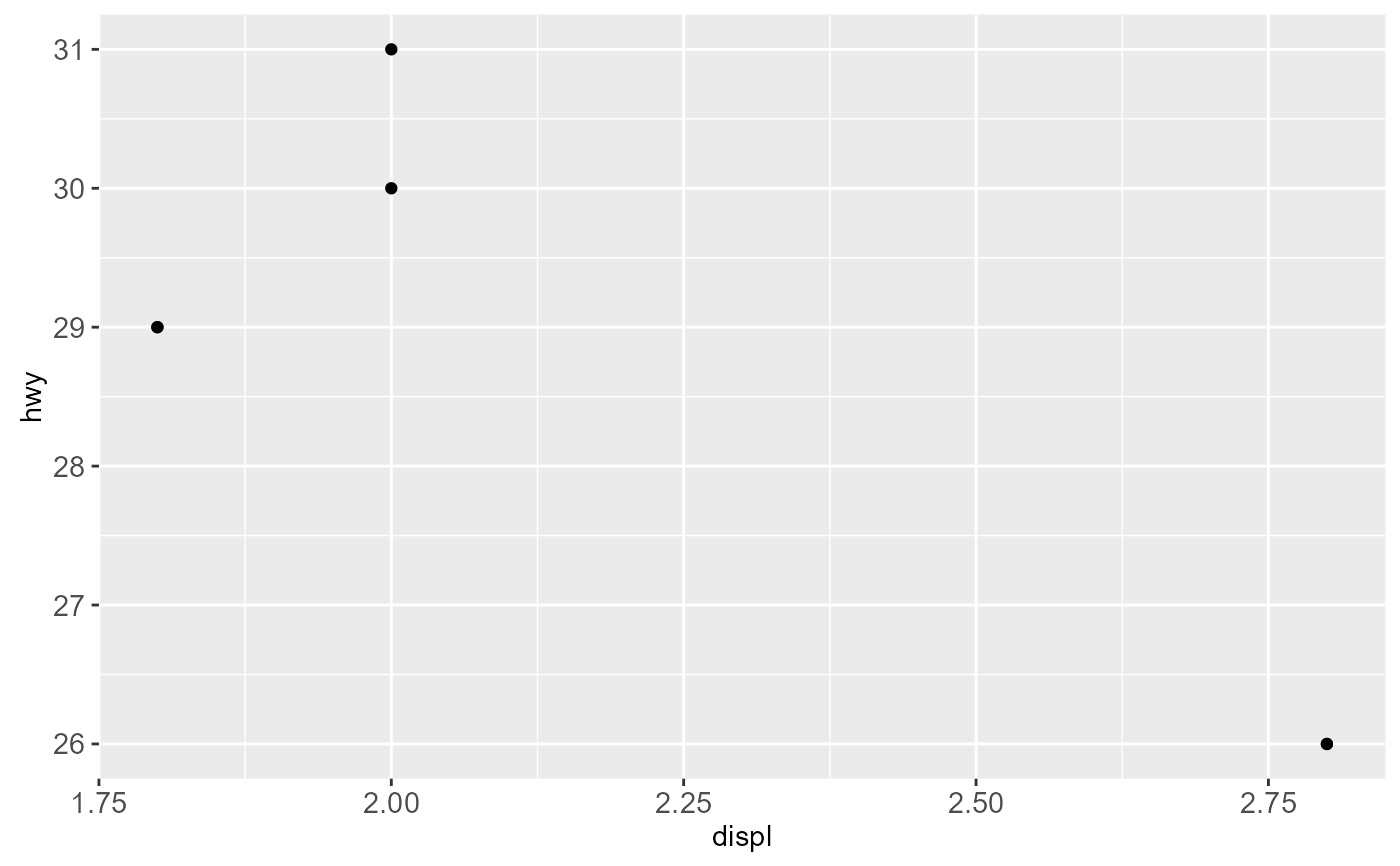
 # use a function as data to plot a subset of global data
ggplot(mpg, aes(displ, hwy)) +
layer(geom = "point", stat = "identity", position = "identity",
data = head, params = list(na.rm = FALSE)
)
# use a function as data to plot a subset of global data
ggplot(mpg, aes(displ, hwy)) +
layer(geom = "point", stat = "identity", position = "identity",
data = head, params = list(na.rm = FALSE)
)