Lay out panels in a grid.
Usage
facet_grid(
  facets,
  margins = FALSE,
  scales = "fixed",
  space = "fixed",
  shrink = TRUE,
  labeller = "label_value",
  as.table = TRUE,
  switch = NULL,
  drop = TRUE
)
Arguments
- facets
a formula with the rows (of the tabular display) on the LHS and the columns (of the tabular display) on the RHS; the dot in the formula is used to indicate there should be no faceting on this dimension (either row or column). The formula can also be provided as a string instead of a classical formula object
- margins
either a logical value or a character vector. Margins are additional facets which contain all the data for each of the possible values of the faceting variables. If
FALSE, no additional facets are included (the default). IfTRUE, margins are included for all faceting variables. If specified as a character vector, it is the names of variables for which margins are to be created.- scales
Are scales shared across all facets (the default,
"fixed"), or do they vary across rows ("free_x"), columns ("free_y"), or both rows and columns ("free")- space
If
"fixed", the default, all panels have the same size. If"free_y"their height will be proportional to the length of the y scale; if"free_x"their width will be proportional to the length of the x scale; or if"free"both height and width will vary. This setting has no effect unless the appropriate scales also vary.- shrink
If
TRUE, will shrink scales to fit output of statistics, not raw data. IfFALSE, will be range of raw data before statistical summary.- labeller
A function that takes one data frame of labels and returns a list or data frame of character vectors. Each input column corresponds to one factor. Thus there will be more than one with formulae of the type
~cyl + am. Each output column gets displayed as one separate line in the strip label. This function should inherit from the "labeller" S3 class for compatibility withlabeller(). Seelabel_valuefor more details and pointers to other options.- as.table
If
TRUE, the default, the facets are laid out like a table with highest values at the bottom-right. IfFALSE, the facets are laid out like a plot with the highest value at the top-right.- switch
By default, the labels are displayed on the top and right of the plot. If
"x", the top labels will be displayed to the bottom. If"y", the right-hand side labels will be displayed to the left. Can also be set to"both".- drop
If
TRUE, the default, all factor levels not used in the data will automatically be dropped. IfFALSE, all factor levels will be shown, regardless of whether or not they appear in the data.
Examples
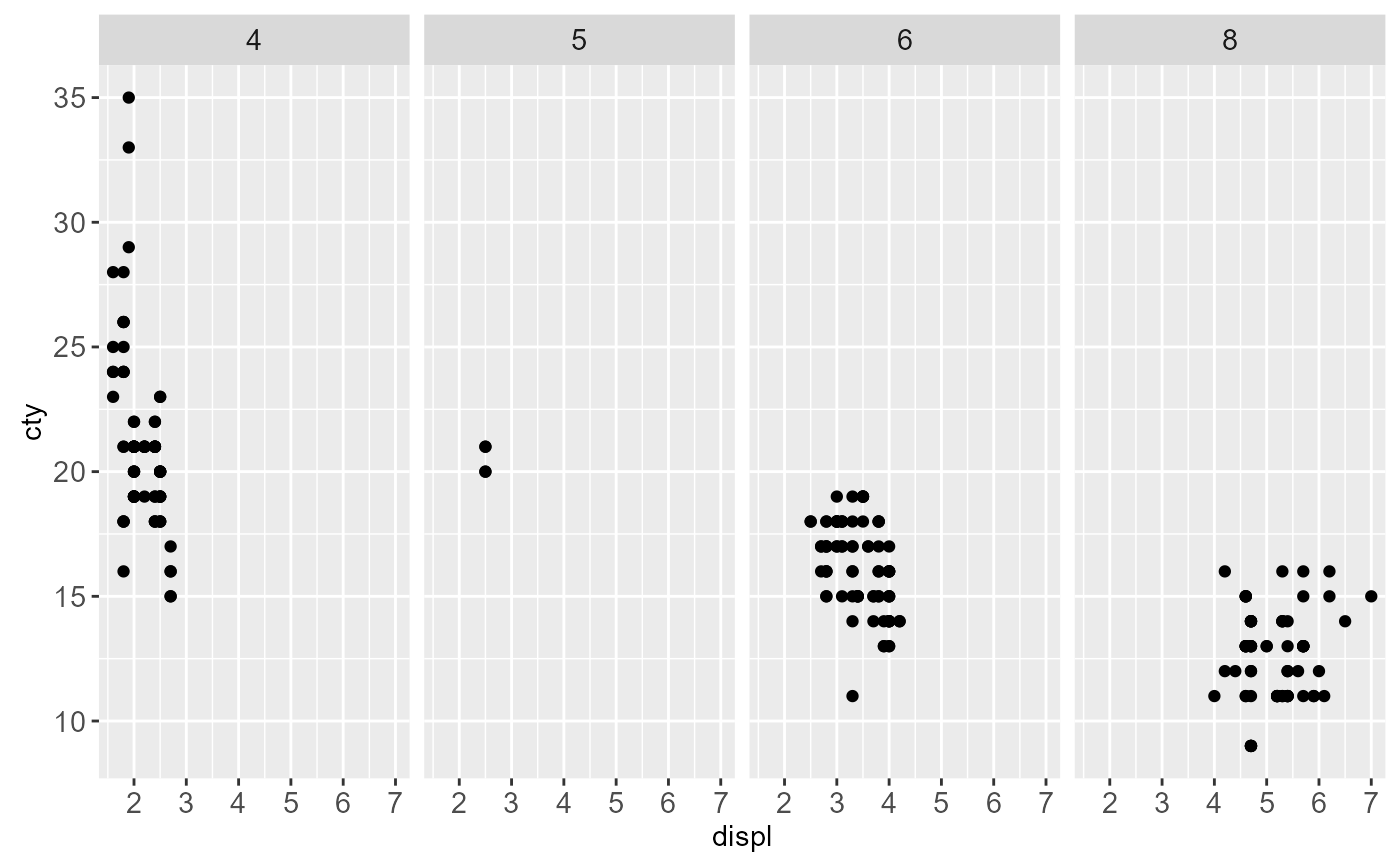
p <- ggplot(mpg, aes(displ, cty)) + geom_point()
p + facet_grid(. ~ cyl)
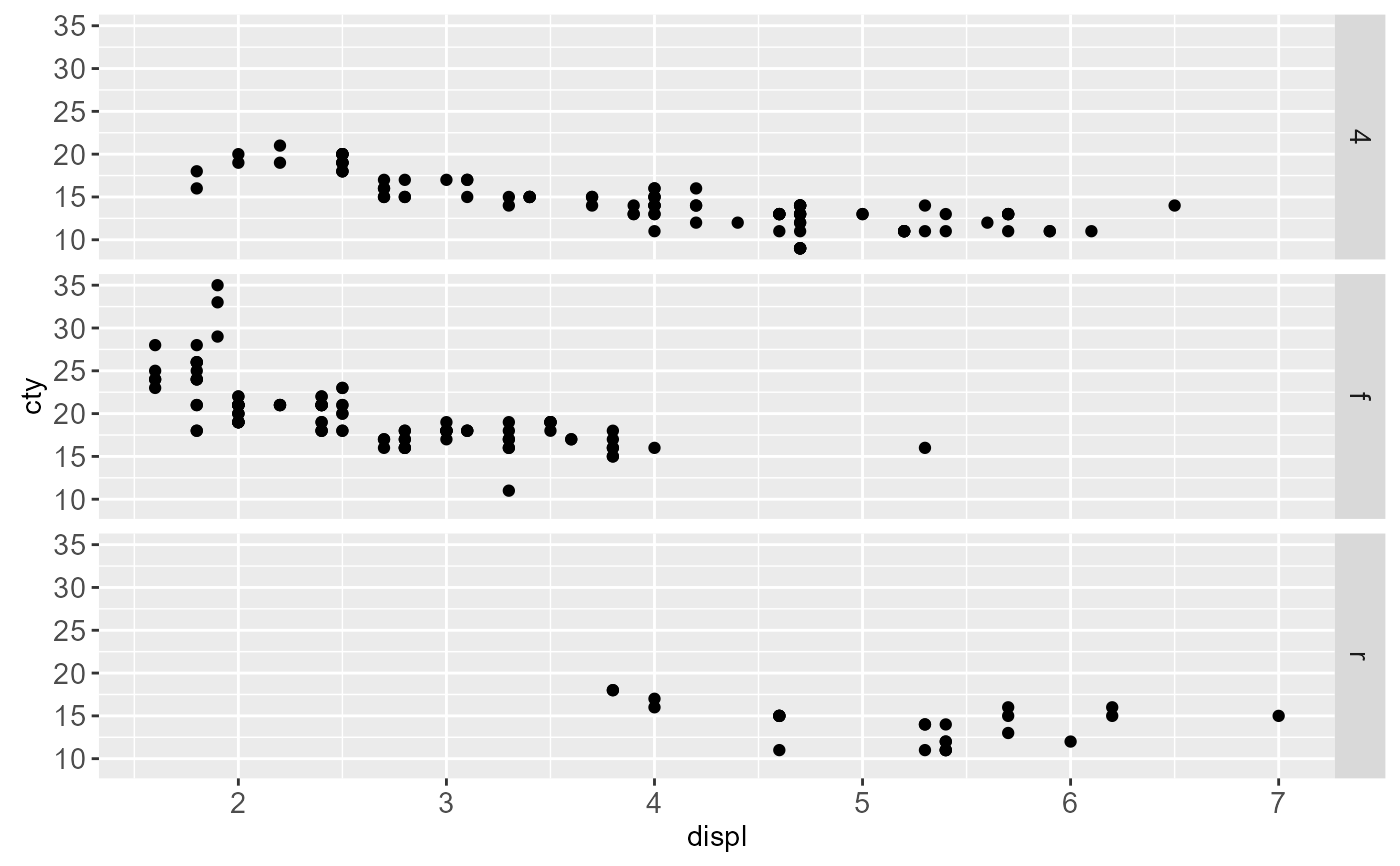
 p + facet_grid(drv ~ .)
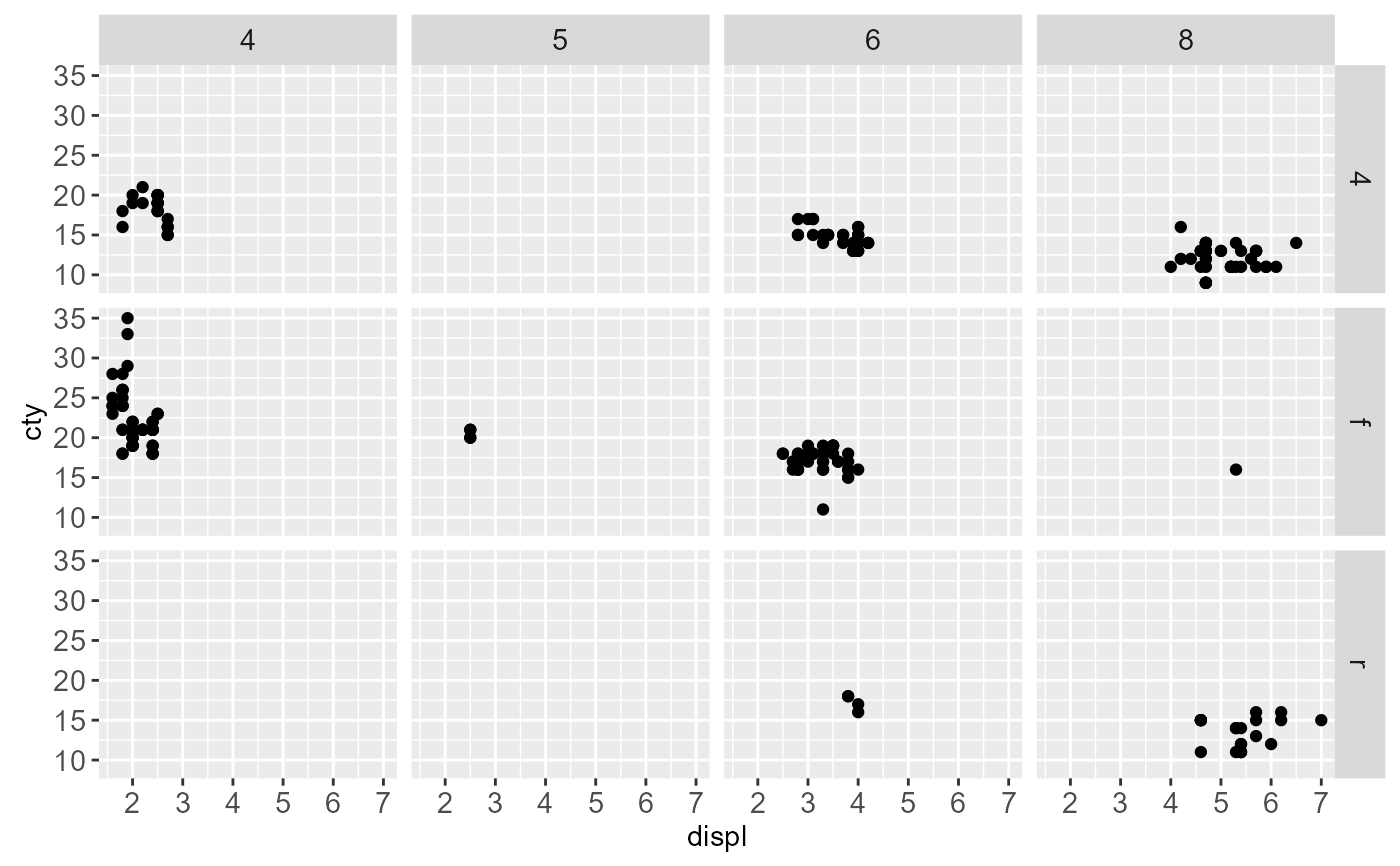
 p + facet_grid(drv ~ cyl)
 # To change plot order of facet grid,
# change the order of variable levels with factor()
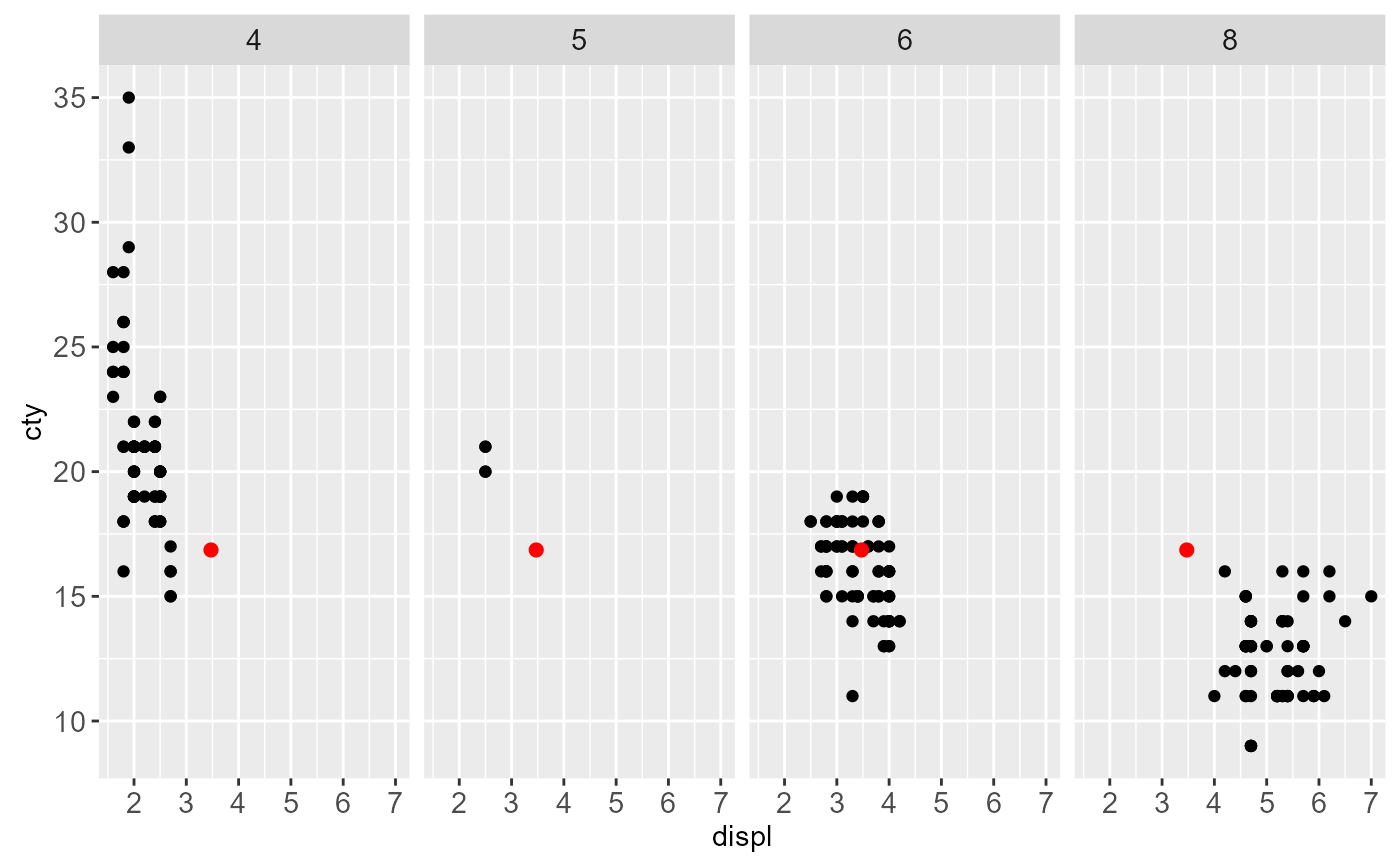
# If you combine a facetted dataset with a dataset that lacks those
# facetting variables, the data will be repeated across the missing
# combinations:
df <- data.frame(displ = mean(mpg$displ), cty = mean(mpg$cty))
p +
facet_grid(. ~ cyl) +
geom_point(data = df, colour = "red", size = 2)
# To change plot order of facet grid,
# change the order of variable levels with factor()
# If you combine a facetted dataset with a dataset that lacks those
# facetting variables, the data will be repeated across the missing
# combinations:
df <- data.frame(displ = mean(mpg$displ), cty = mean(mpg$cty))
p +
facet_grid(. ~ cyl) +
geom_point(data = df, colour = "red", size = 2)
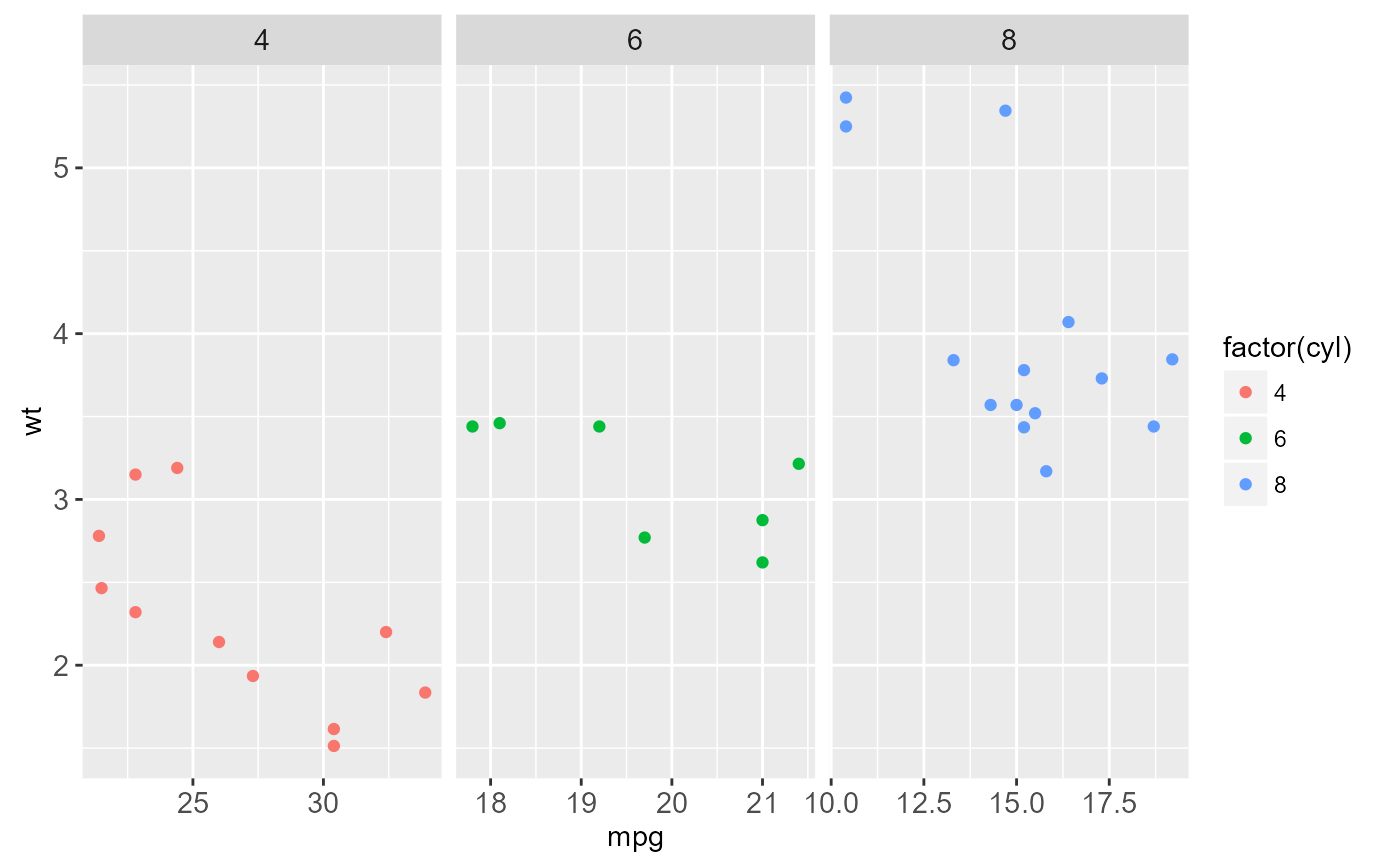
 # Free scales -------------------------------------------------------
# You can also choose whether the scales should be constant
# across all panels (the default), or whether they should be allowed
# to vary
mt <- ggplot(mtcars, aes(mpg, wt, colour = factor(cyl))) +
geom_point()
mt + facet_grid(. ~ cyl, scales = "free")
# Free scales -------------------------------------------------------
# You can also choose whether the scales should be constant
# across all panels (the default), or whether they should be allowed
# to vary
mt <- ggplot(mtcars, aes(mpg, wt, colour = factor(cyl))) +
geom_point()
mt + facet_grid(. ~ cyl, scales = "free")
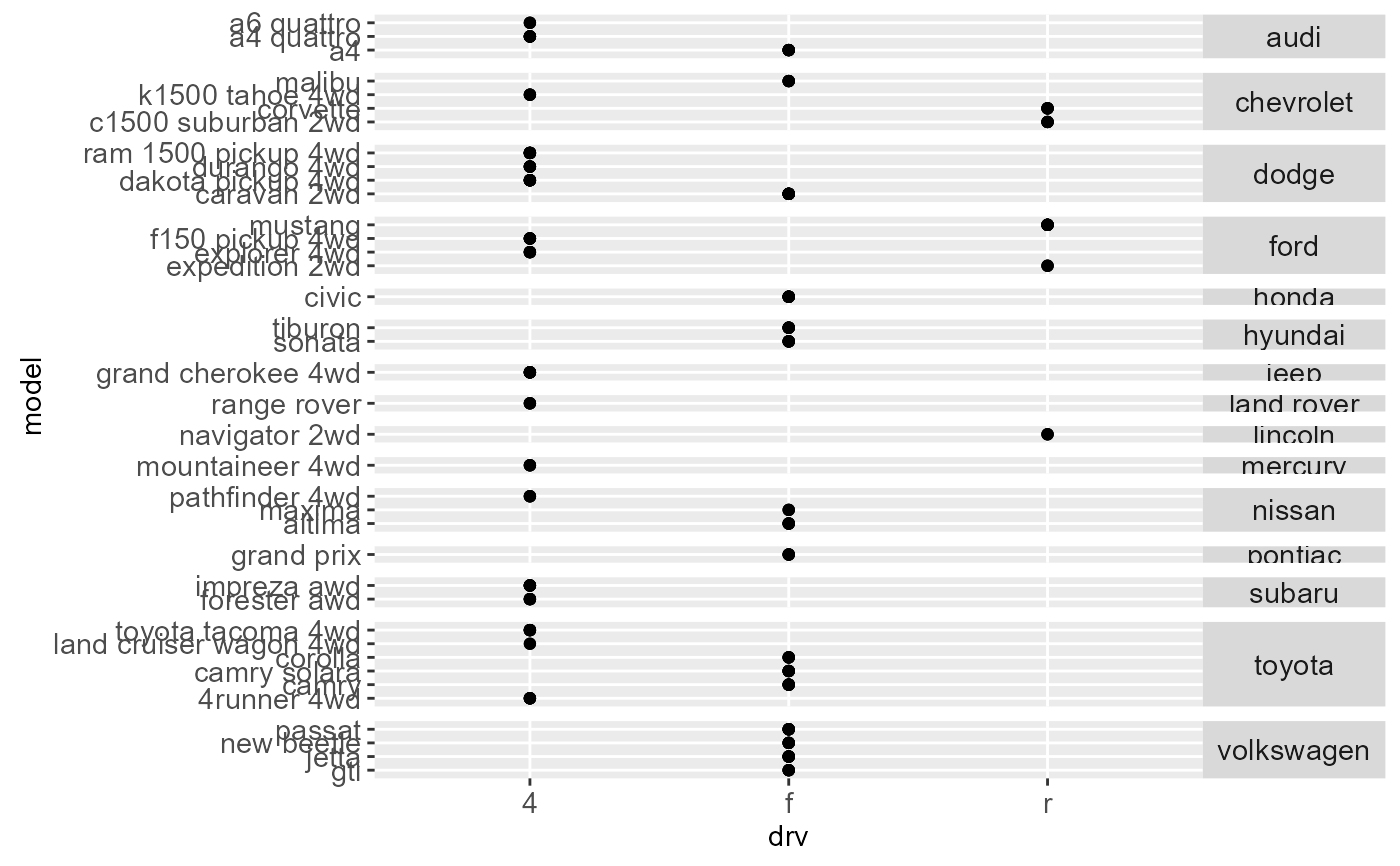
 # If scales and space are free, then the mapping between position
# and values in the data will be the same across all panels. This
# is particularly useful for categorical axes
ggplot(mpg, aes(drv, model)) +
geom_point() +
facet_grid(manufacturer ~ ., scales = "free", space = "free") +
theme(strip.text.y = element_text(angle = 0))
# If scales and space are free, then the mapping between position
# and values in the data will be the same across all panels. This
# is particularly useful for categorical axes
ggplot(mpg, aes(drv, model)) +
geom_point() +
facet_grid(manufacturer ~ ., scales = "free", space = "free") +
theme(strip.text.y = element_text(angle = 0))
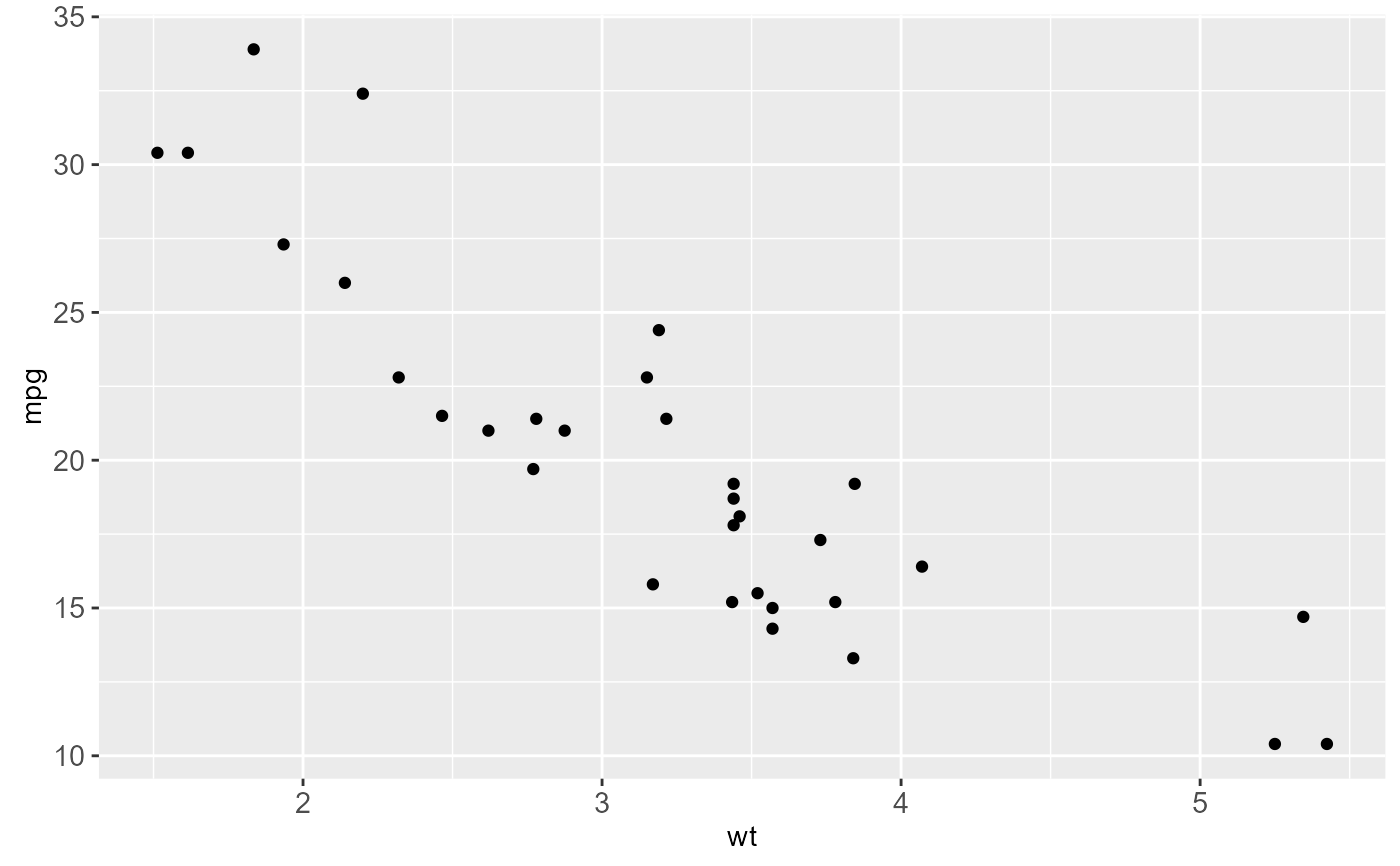
 # Facet labels ------------------------------------------------------
p <- ggplot(mtcars, aes(wt, mpg)) + geom_point()
p
# Facet labels ------------------------------------------------------
p <- ggplot(mtcars, aes(wt, mpg)) + geom_point()
p
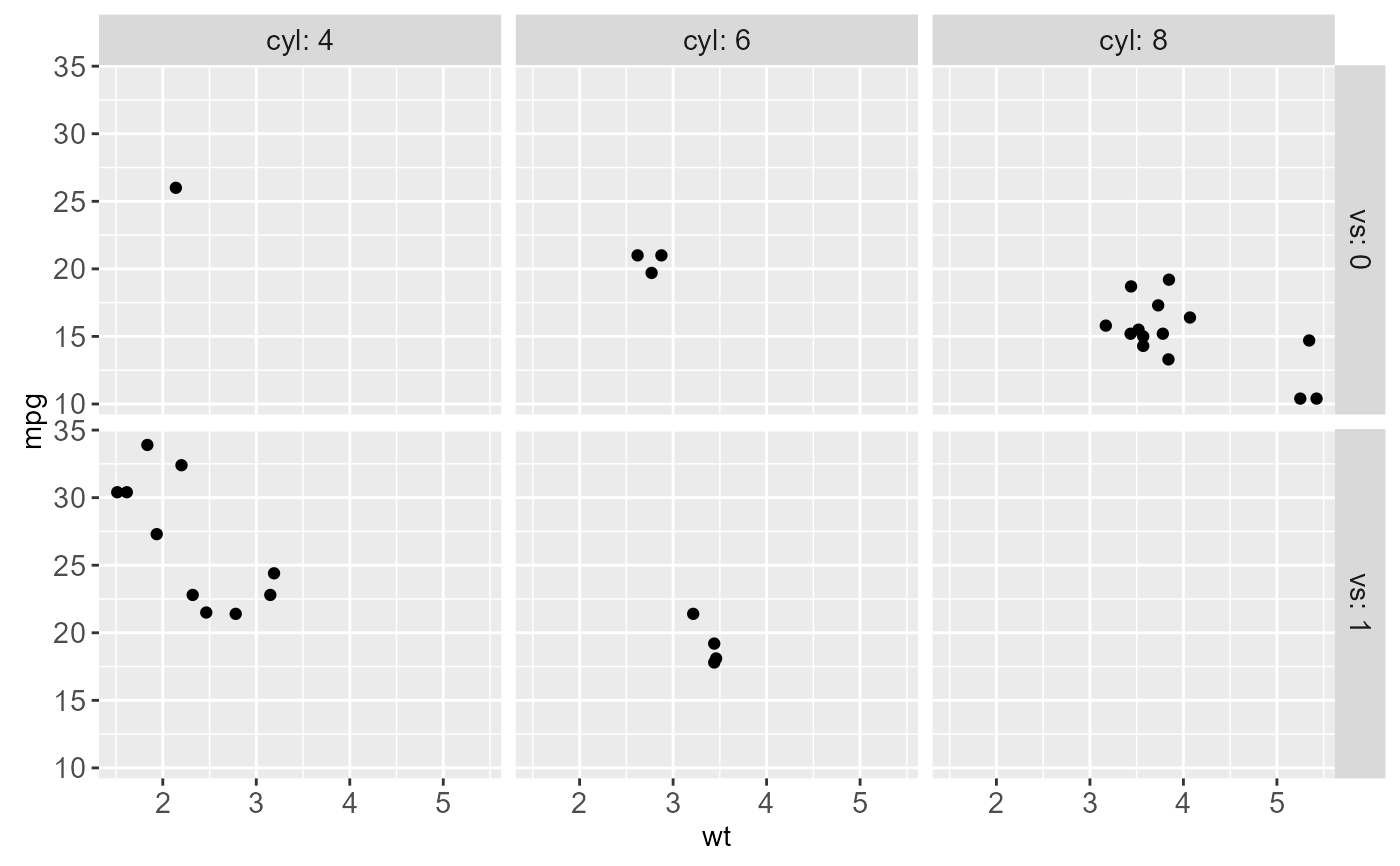
 # label_both() displays both variable name and value
p + facet_grid(vs ~ cyl, labeller = label_both)
# label_both() displays both variable name and value
p + facet_grid(vs ~ cyl, labeller = label_both)
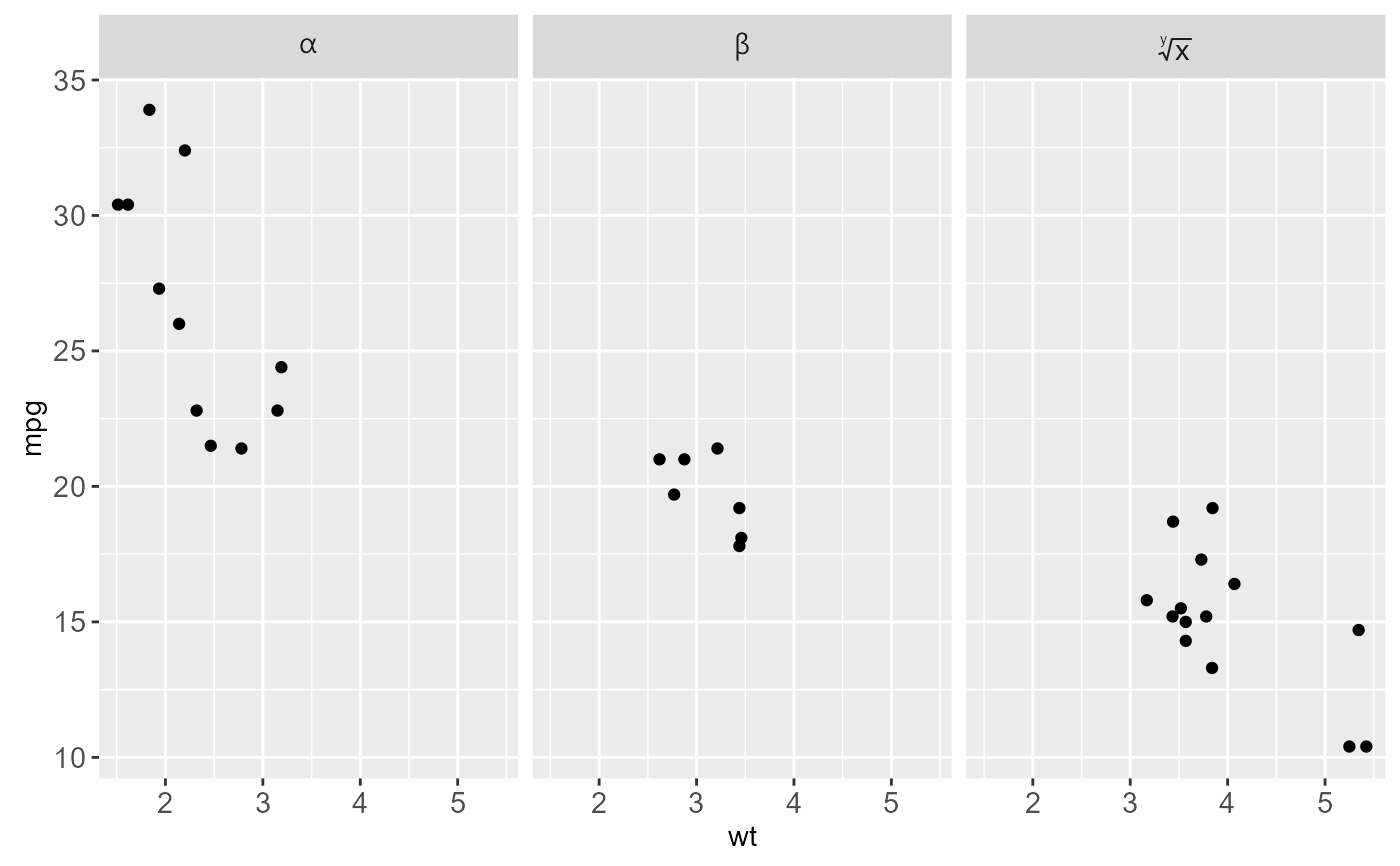
 # label_parsed() parses text into mathematical expressions, see ?plotmath
mtcars$cyl2 <- factor(mtcars$cyl, labels = c("alpha", "beta", "sqrt(x, y)"))
ggplot(mtcars, aes(wt, mpg)) +
geom_point() +
facet_grid(. ~ cyl2, labeller = label_parsed)
# label_parsed() parses text into mathematical expressions, see ?plotmath
mtcars$cyl2 <- factor(mtcars$cyl, labels = c("alpha", "beta", "sqrt(x, y)"))
ggplot(mtcars, aes(wt, mpg)) +
geom_point() +
facet_grid(. ~ cyl2, labeller = label_parsed)
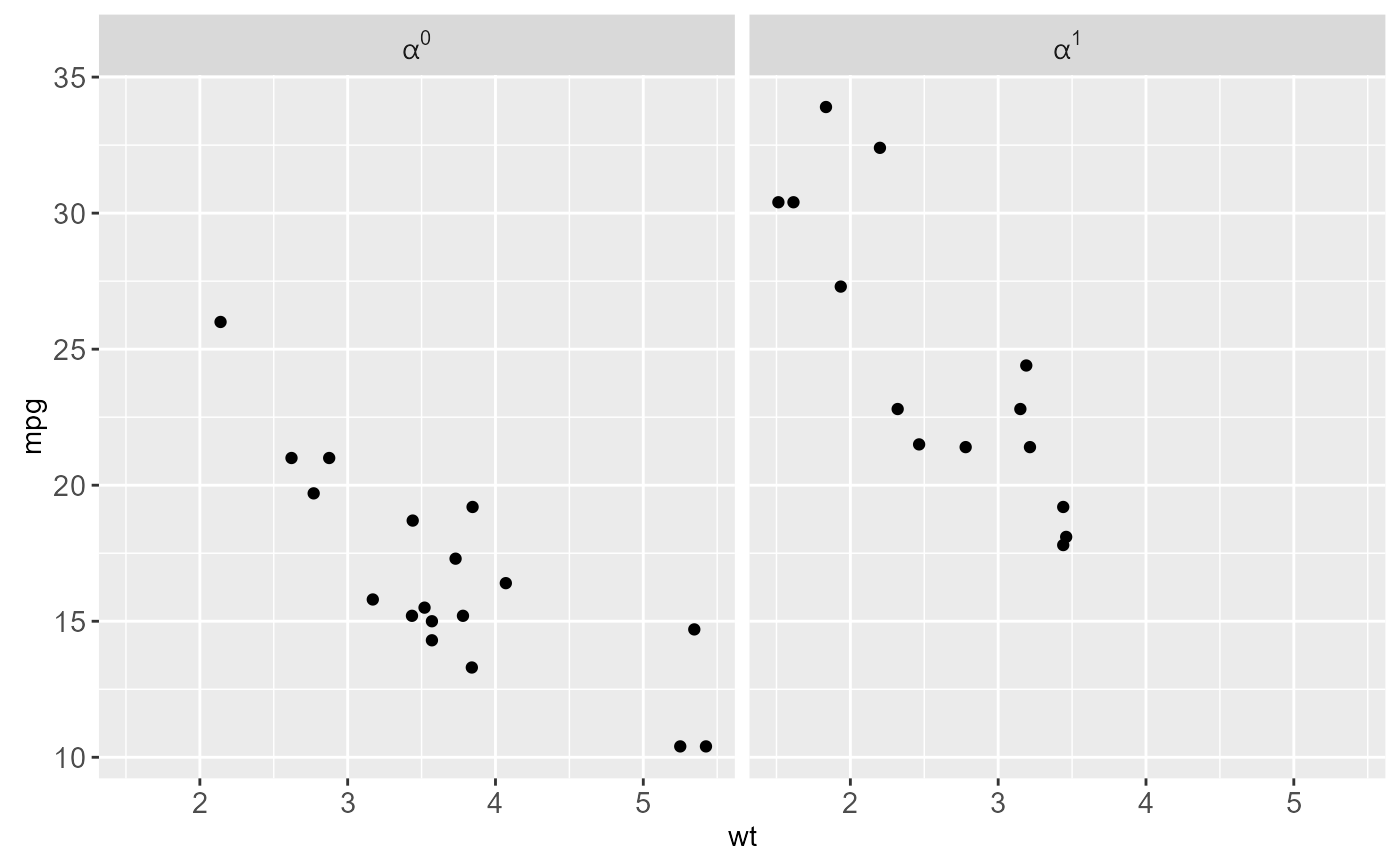
 # label_bquote() makes it easy to construct math expressions
p + facet_grid(. ~ vs, labeller = label_bquote(cols = alpha ^ .(vs)))
# label_bquote() makes it easy to construct math expressions
p + facet_grid(. ~ vs, labeller = label_bquote(cols = alpha ^ .(vs)))
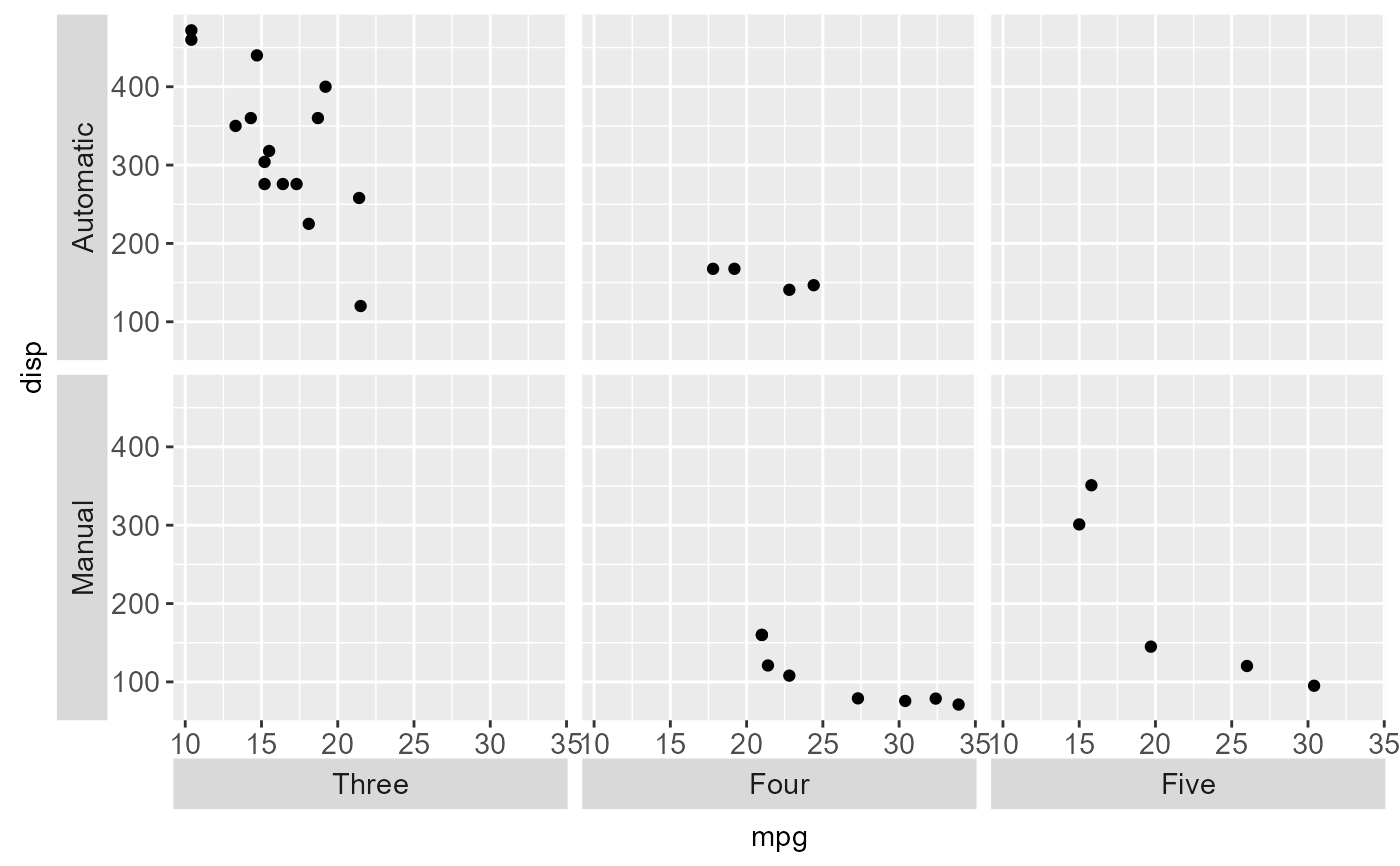
 # The facet strips can be displayed near the axes with switch
data <- transform(mtcars,
am = factor(am, levels = 0:1, c("Automatic", "Manual")),
gear = factor(gear, levels = 3:5, labels = c("Three", "Four", "Five"))
)
p <- ggplot(data, aes(mpg, disp)) + geom_point()
p + facet_grid(am ~ gear, switch = "both")
# The facet strips can be displayed near the axes with switch
data <- transform(mtcars,
am = factor(am, levels = 0:1, c("Automatic", "Manual")),
gear = factor(gear, levels = 3:5, labels = c("Three", "Four", "Five"))
)
p <- ggplot(data, aes(mpg, disp)) + geom_point()
p + facet_grid(am ~ gear, switch = "both")
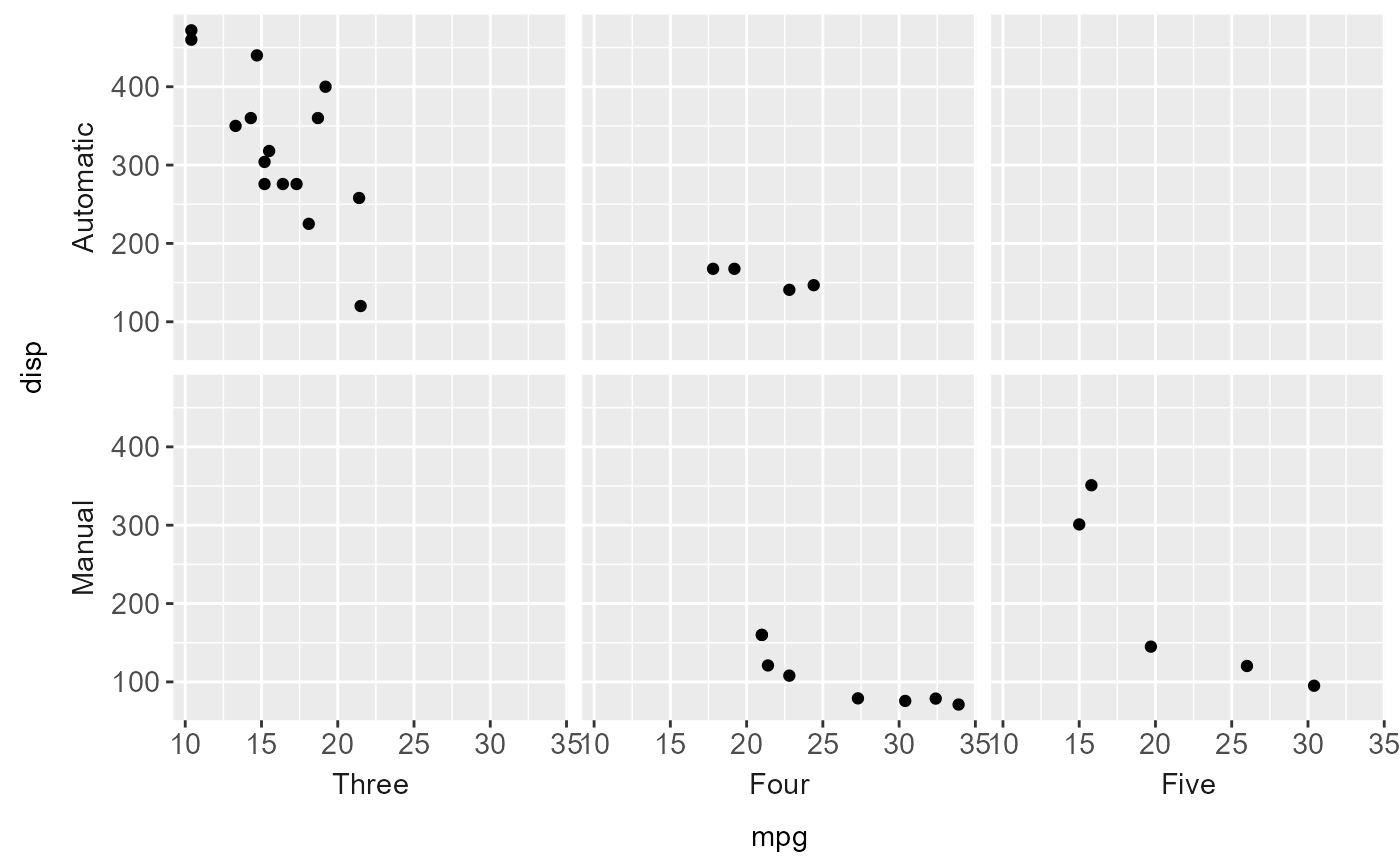
 # It looks better without boxes around the strips
p + facet_grid(am ~ gear, switch = "both") +
theme(strip.background = element_blank())
# It looks better without boxes around the strips
p + facet_grid(am ~ gear, switch = "both") +
theme(strip.background = element_blank())
 # Margins ----------------------------------------------------------
# \donttest{
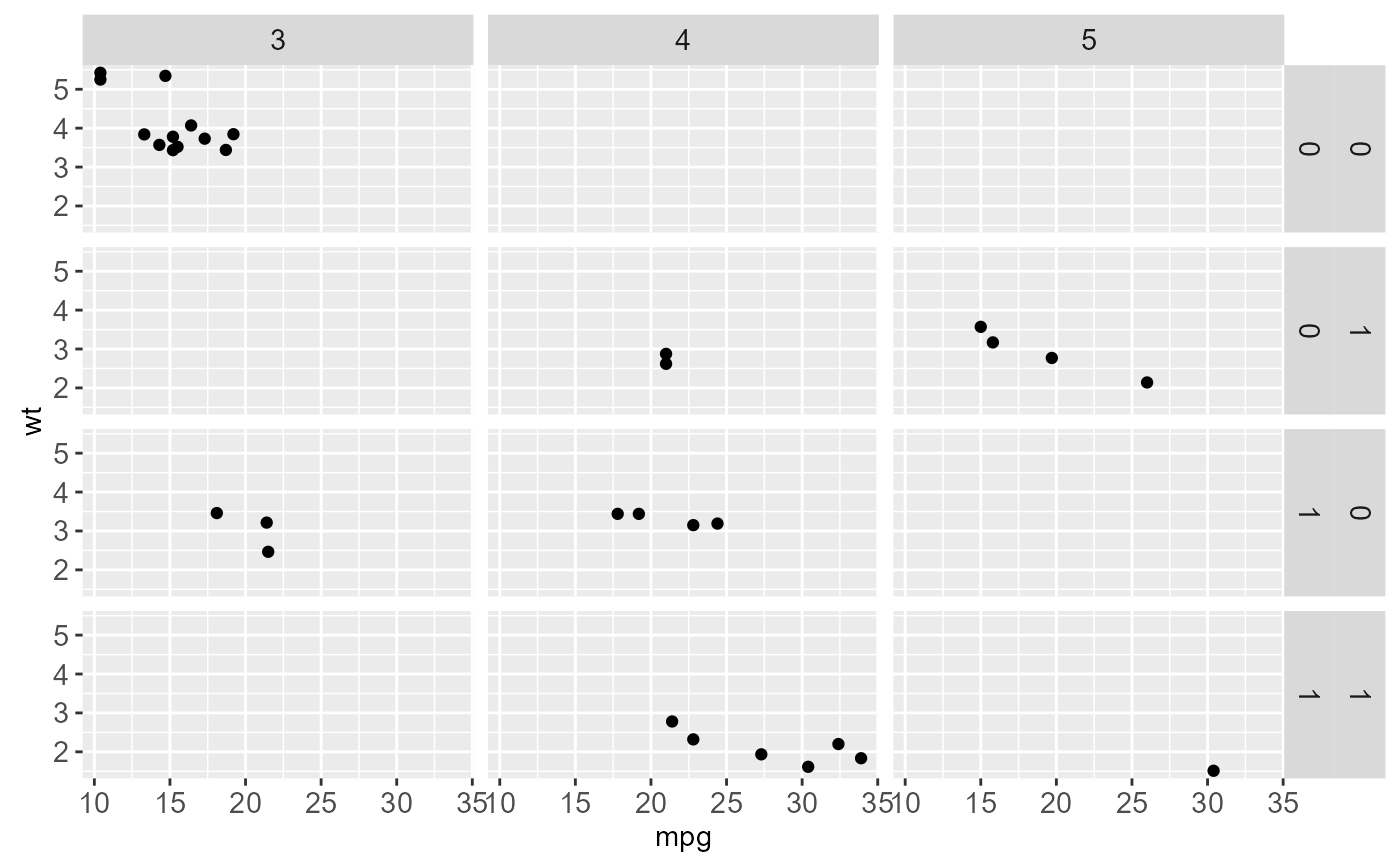
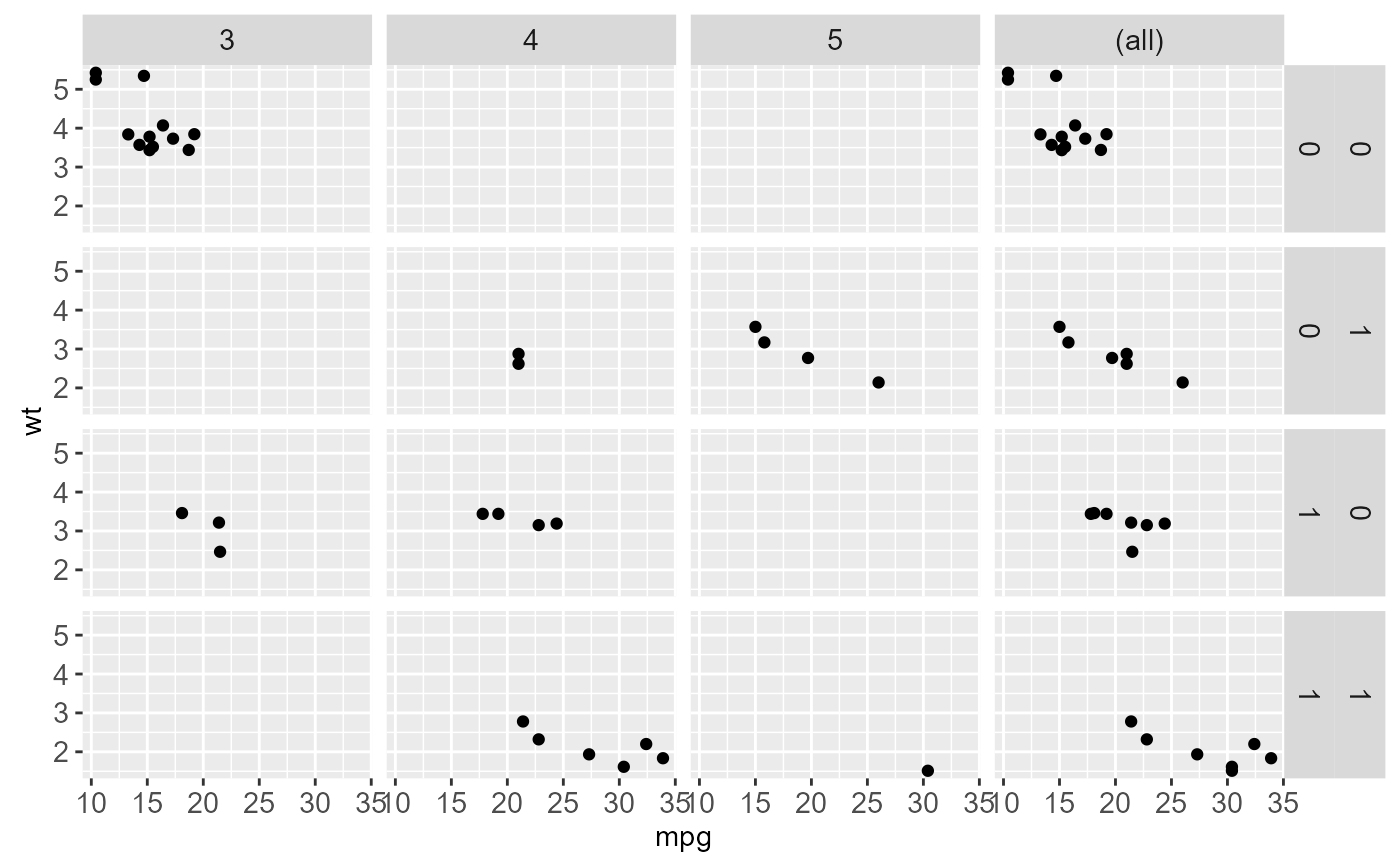
# Margins can be specified by logically (all yes or all no) or by specific
# variables as (character) variable names
mg <- ggplot(mtcars, aes(x = mpg, y = wt)) + geom_point()
mg + facet_grid(vs + am ~ gear)
# Margins ----------------------------------------------------------
# \donttest{
# Margins can be specified by logically (all yes or all no) or by specific
# variables as (character) variable names
mg <- ggplot(mtcars, aes(x = mpg, y = wt)) + geom_point()
mg + facet_grid(vs + am ~ gear)
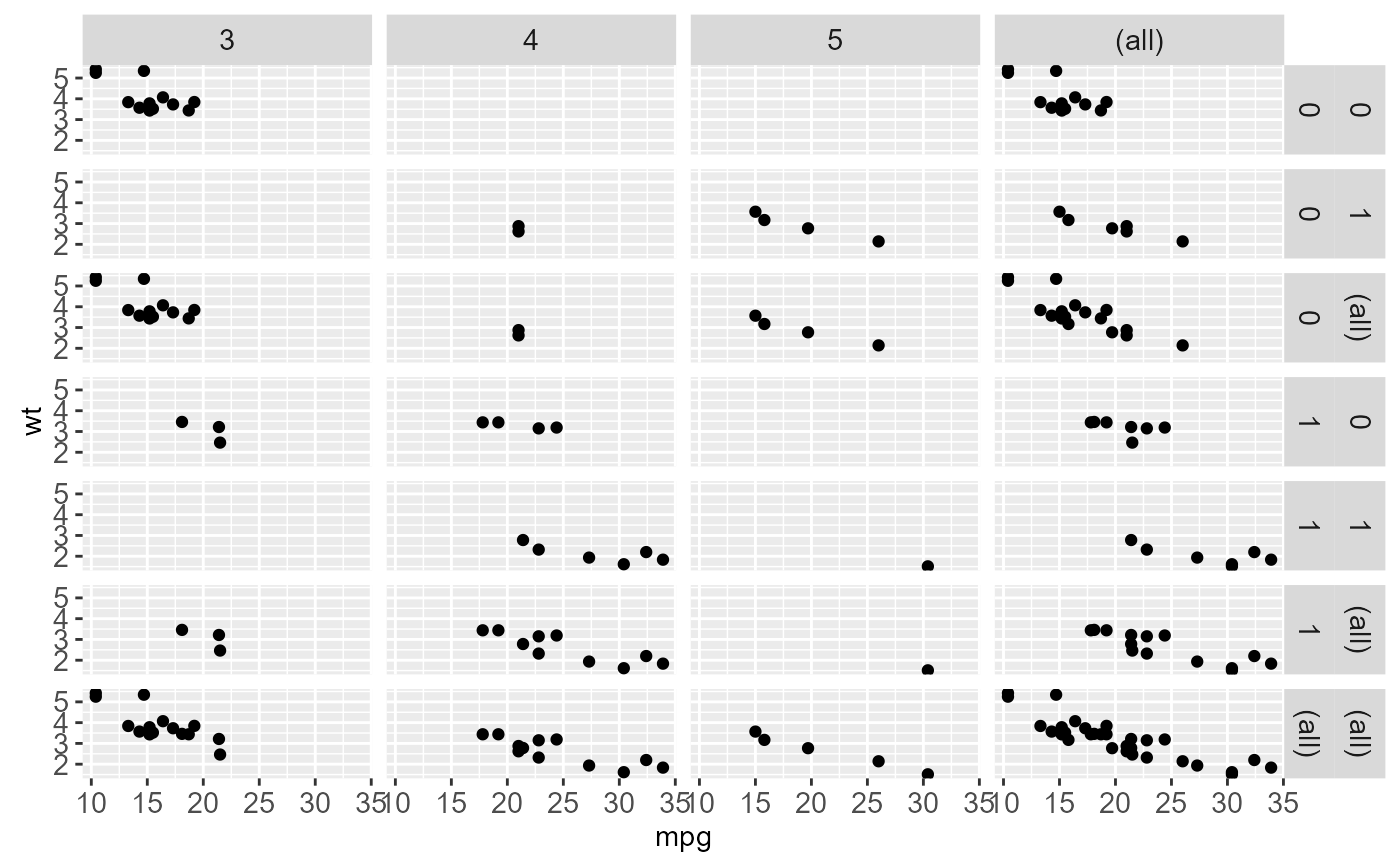
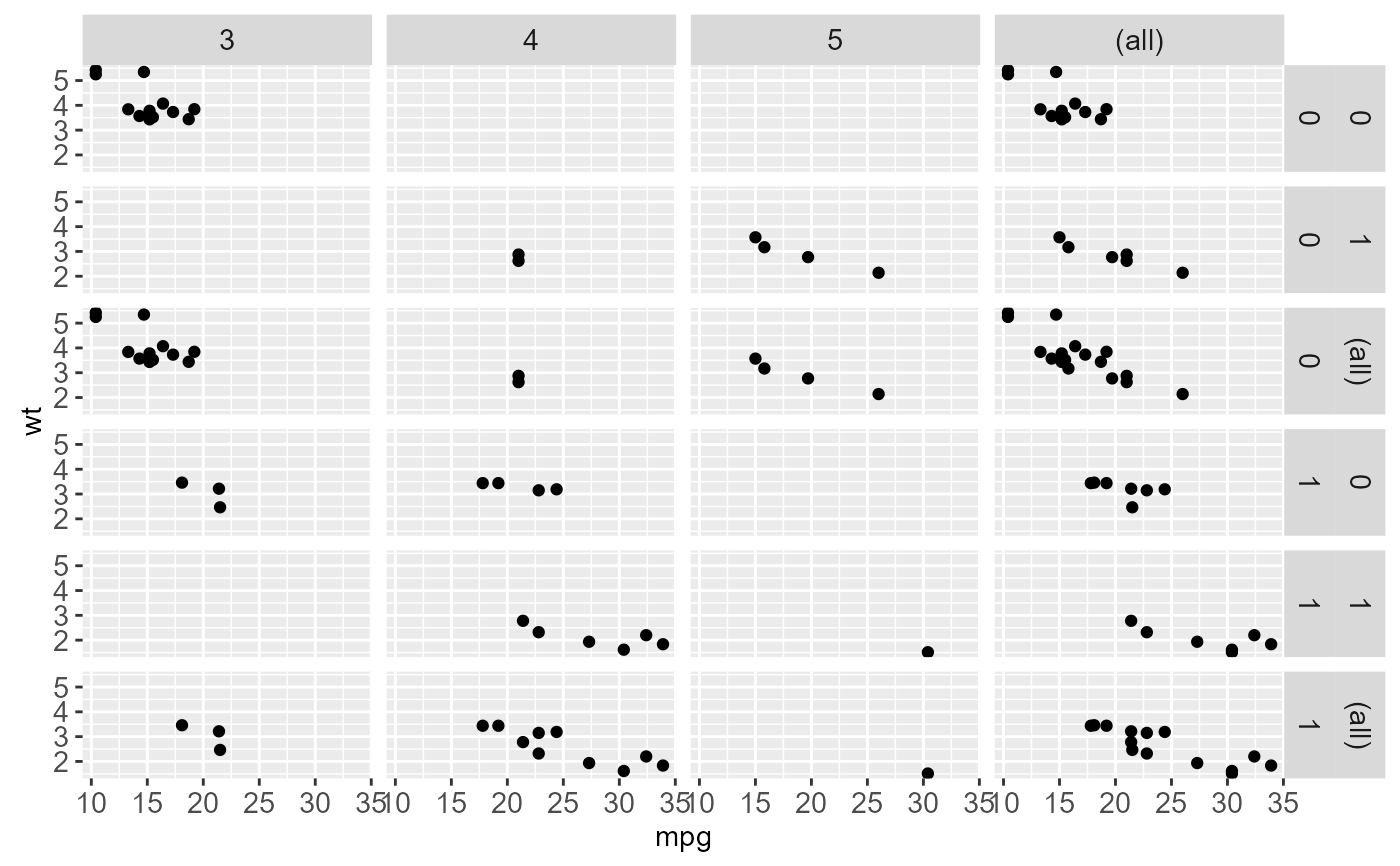
 mg + facet_grid(vs + am ~ gear, margins = TRUE)
 mg + facet_grid(vs + am ~ gear, margins = "am")
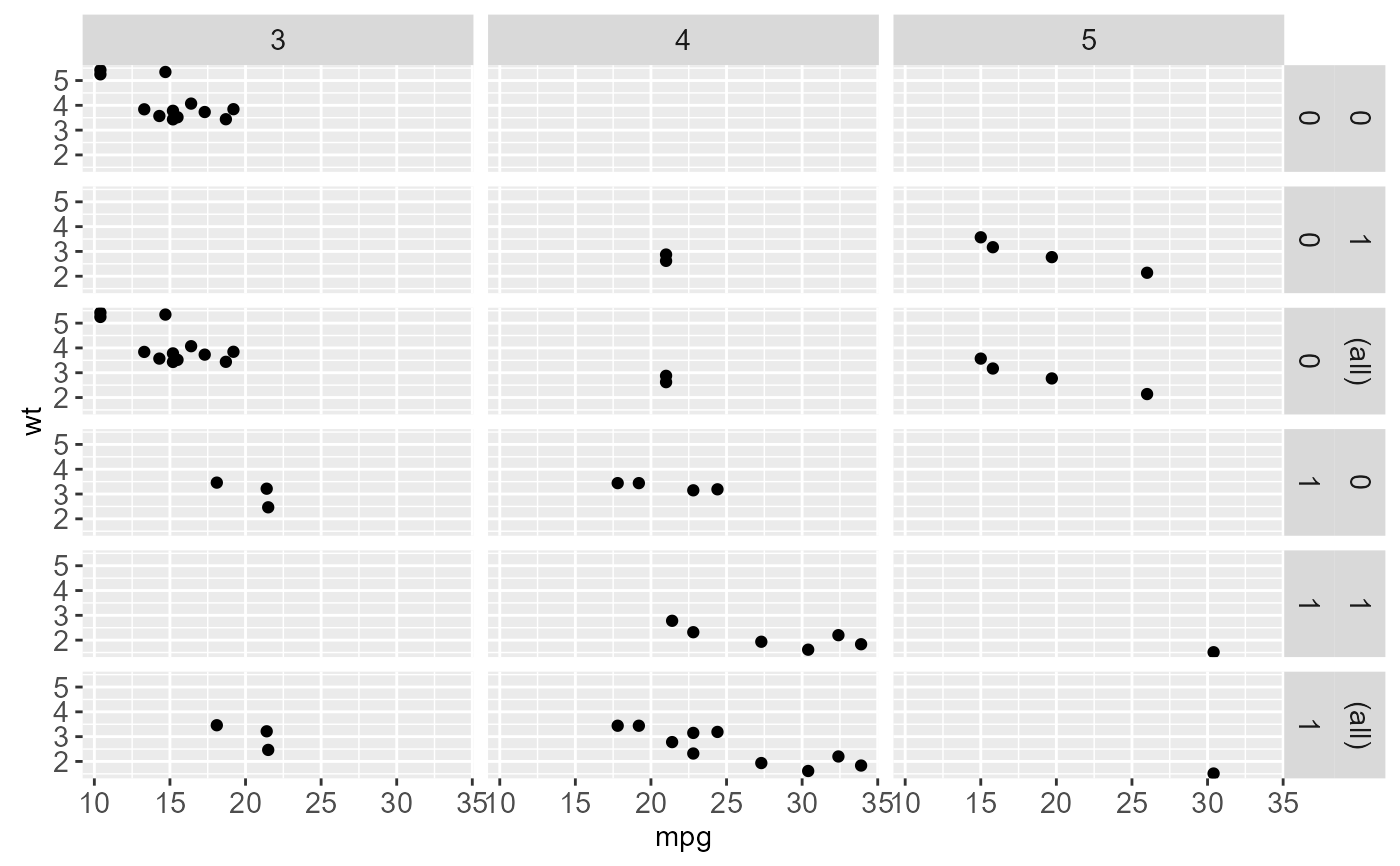 # when margins are made over "vs", since the facets for "am" vary
# within the values of "vs", the marginal facet for "vs" is also
# a margin over "am".
mg + facet_grid(vs + am ~ gear, margins = "vs")
# when margins are made over "vs", since the facets for "am" vary
# within the values of "vs", the marginal facet for "vs" is also
# a margin over "am".
mg + facet_grid(vs + am ~ gear, margins = "vs")
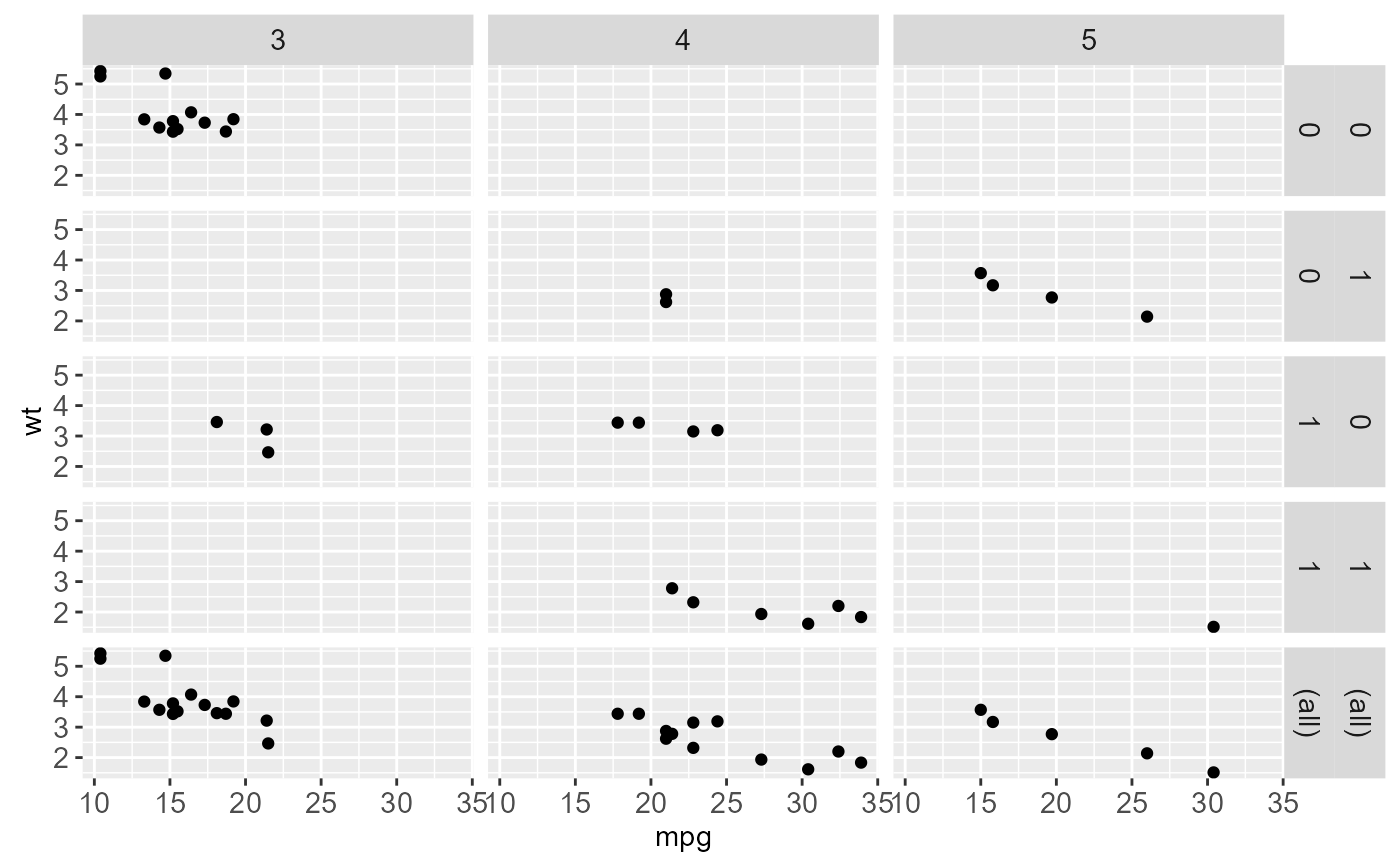 mg + facet_grid(vs + am ~ gear, margins = "gear")
 mg + facet_grid(vs + am ~ gear, margins = c("gear", "am"))
 # }
# }