Differentiation related aesthetics: linetype, size, shape
Source:R/aes-linetype-size-shape.r
aes_linetype_size_shape.RdThis page demonstrates the usage of a sub-group of aesthetics; linetype, size and shape.
Examples
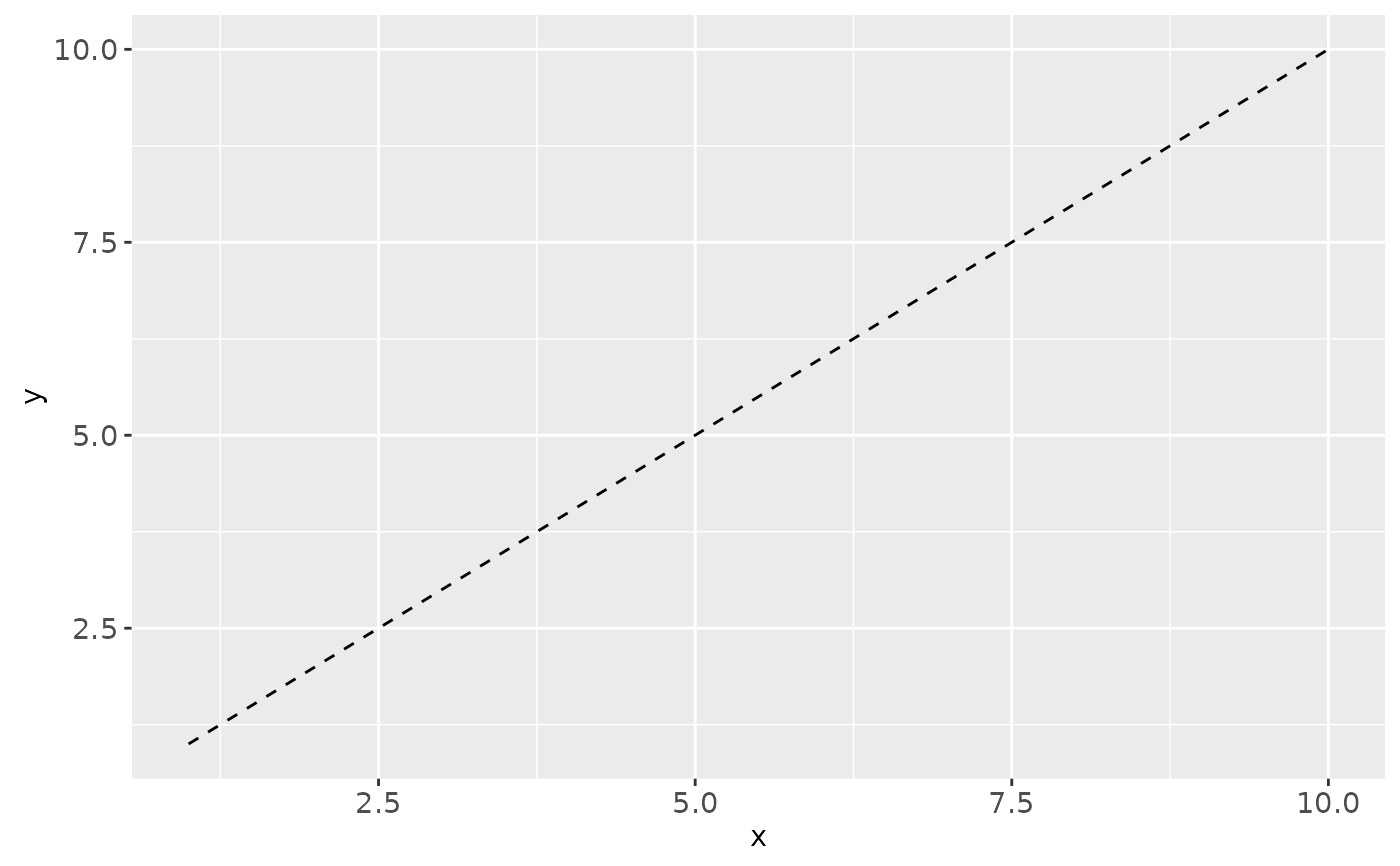
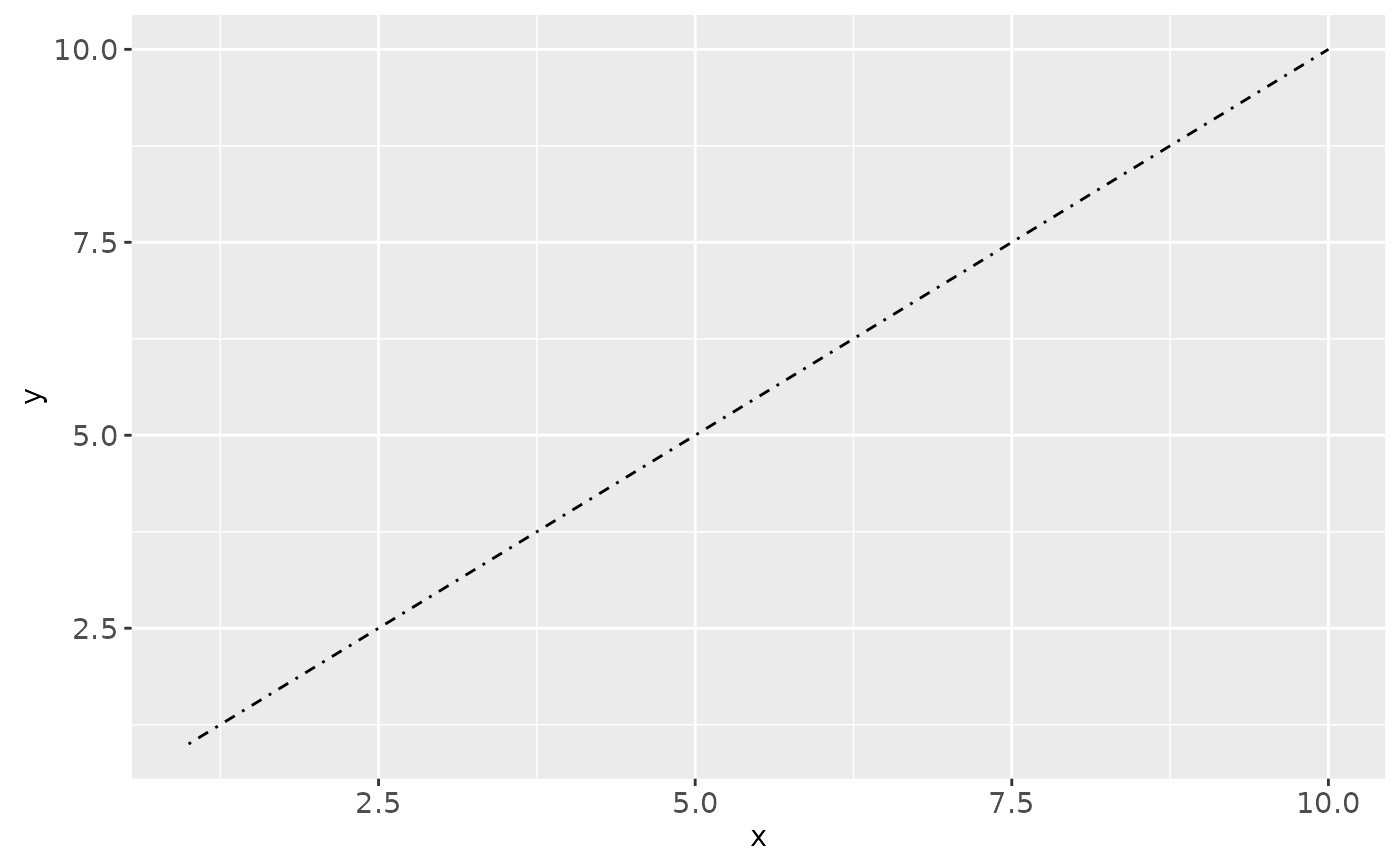
# Line types should be specified with either an integer, a name, or with a string of
# an even number (up to eight) of hexadecimal digits which give the lengths in
# consecutive positions in the string.
# 0 = blank, 1 = solid, 2 = dashed, 3 = dotted, 4 = dotdash, 5 = longdash, 6 = twodash
# Data
df <- data.frame(x = 1:10 , y = 1:10)
f <- ggplot(df, aes(x, y))
f + geom_line(linetype = 2)
 f + geom_line(linetype = "dotdash")
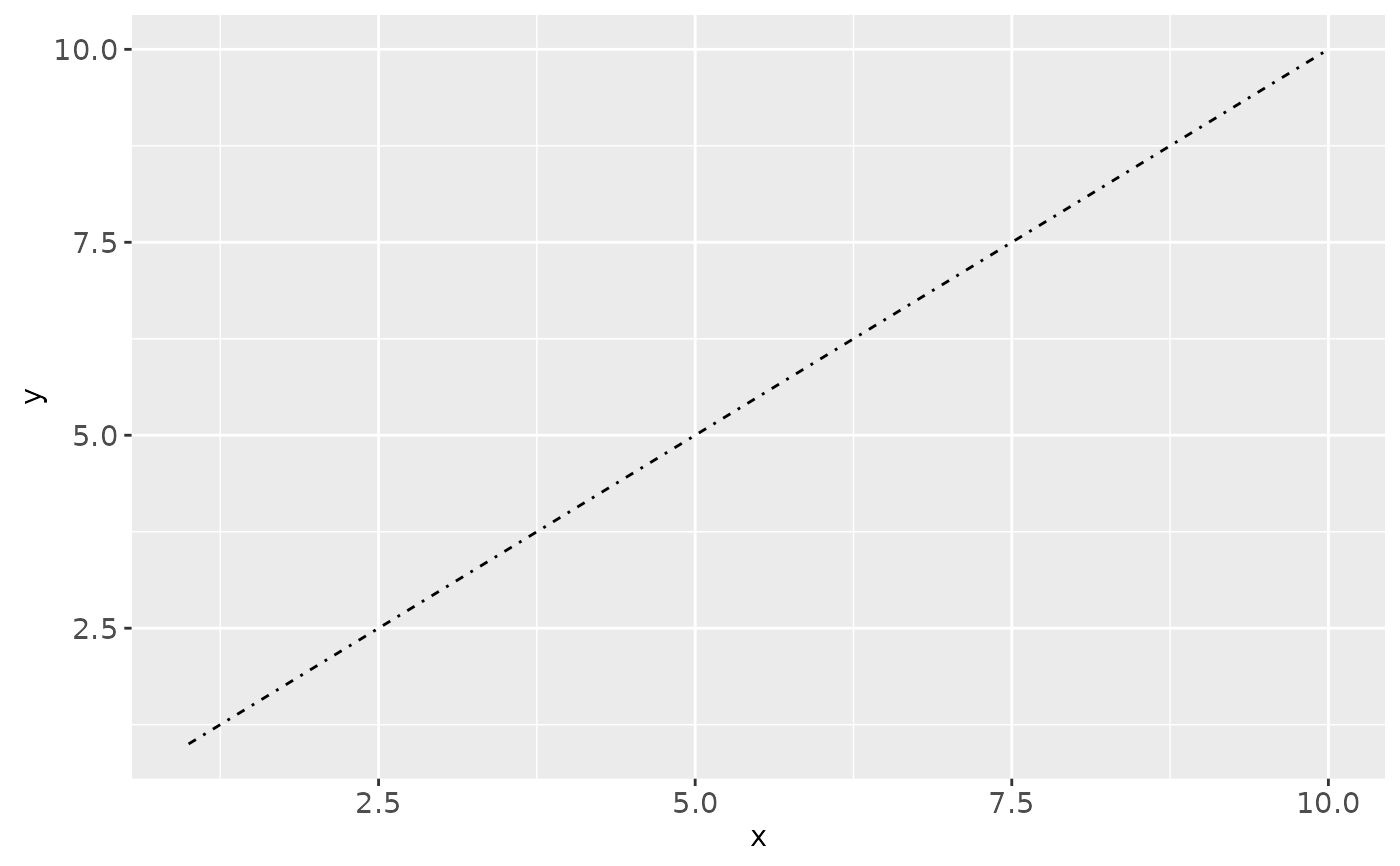
 # An example with hex strings, the string "33" specifies three units on followed
# by three off and "3313" specifies three units on followed by three off followed
# by one on and finally three off.
f + geom_line(linetype = "3313")
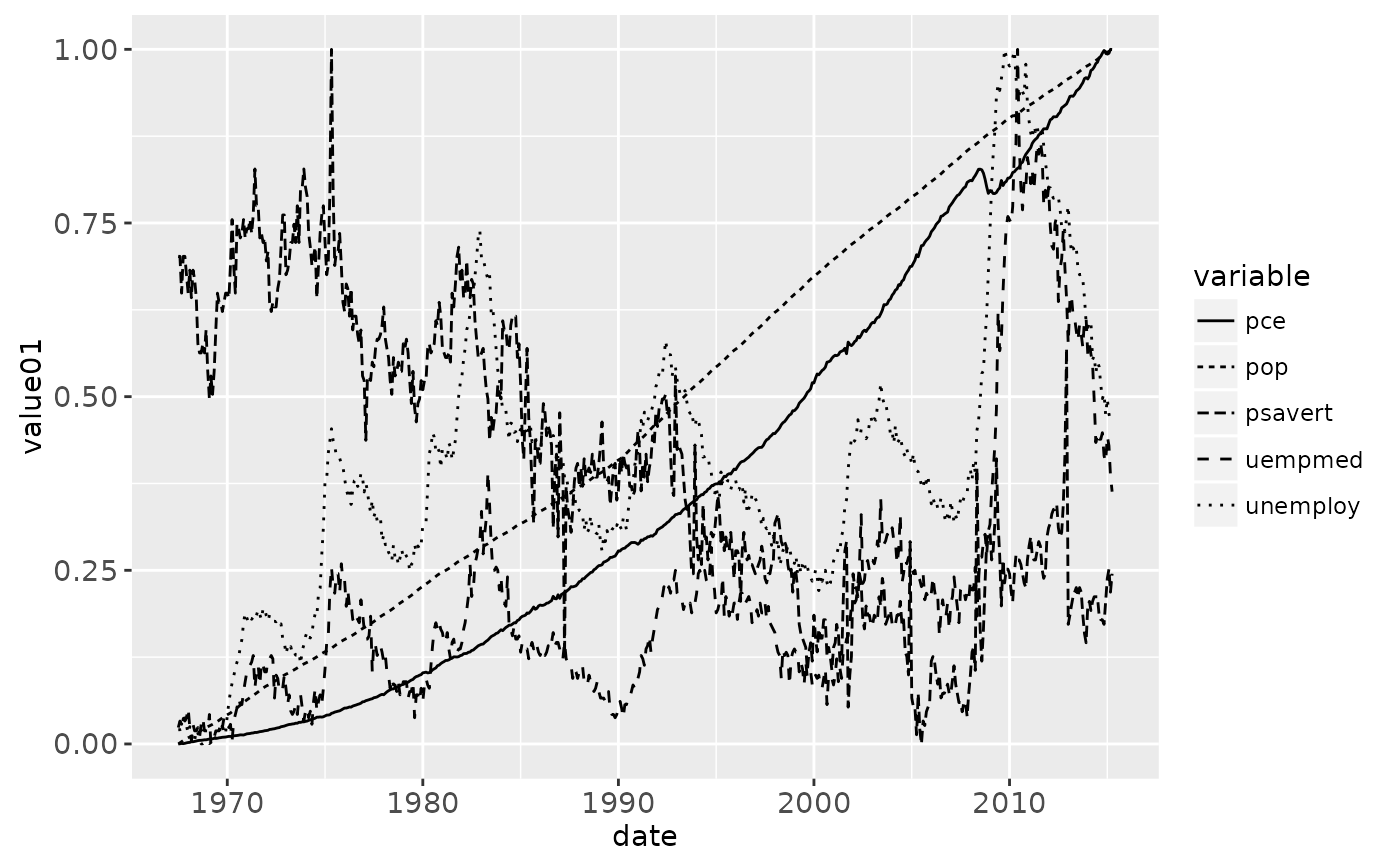
 # Mapping line type from a variable
ggplot(economics_long, aes(date, value01)) +
geom_line(aes(linetype = variable))
 # Size examples
# Should be specified with a numerical value (in millimetres),
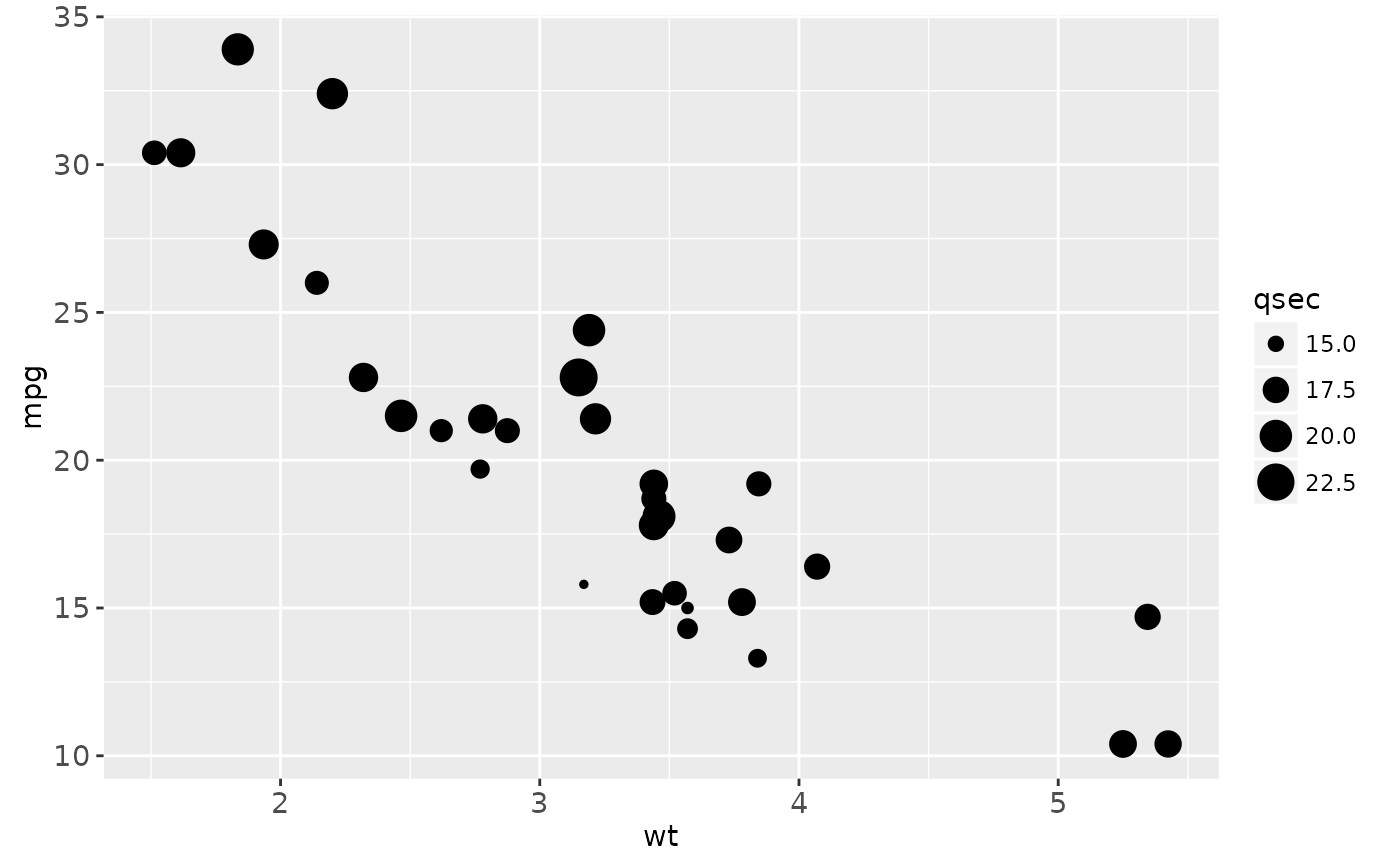
# or from a variable source
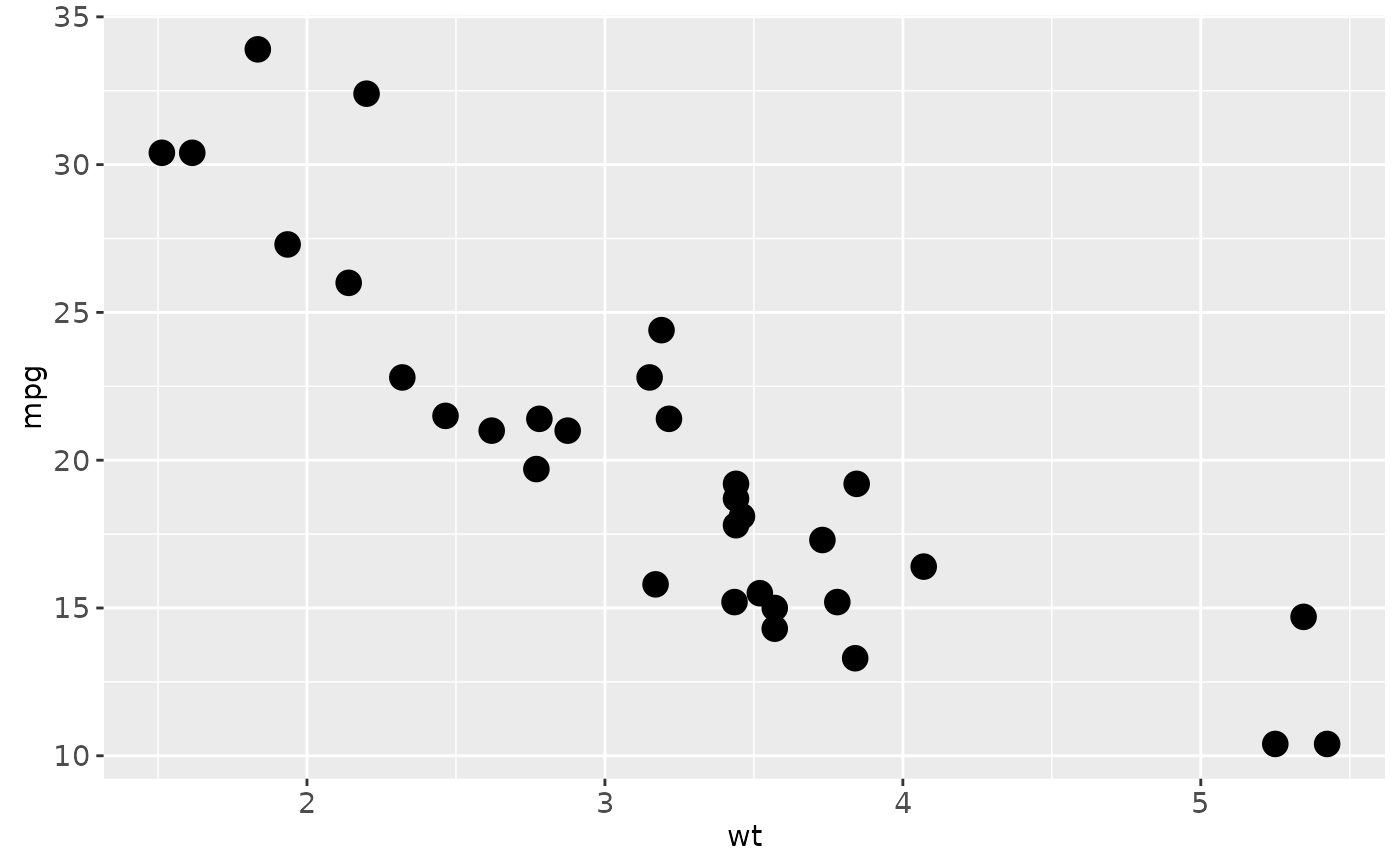
p <- ggplot(mtcars, aes(wt, mpg))
p + geom_point(size = 4)
 p + geom_point(aes(size = qsec))
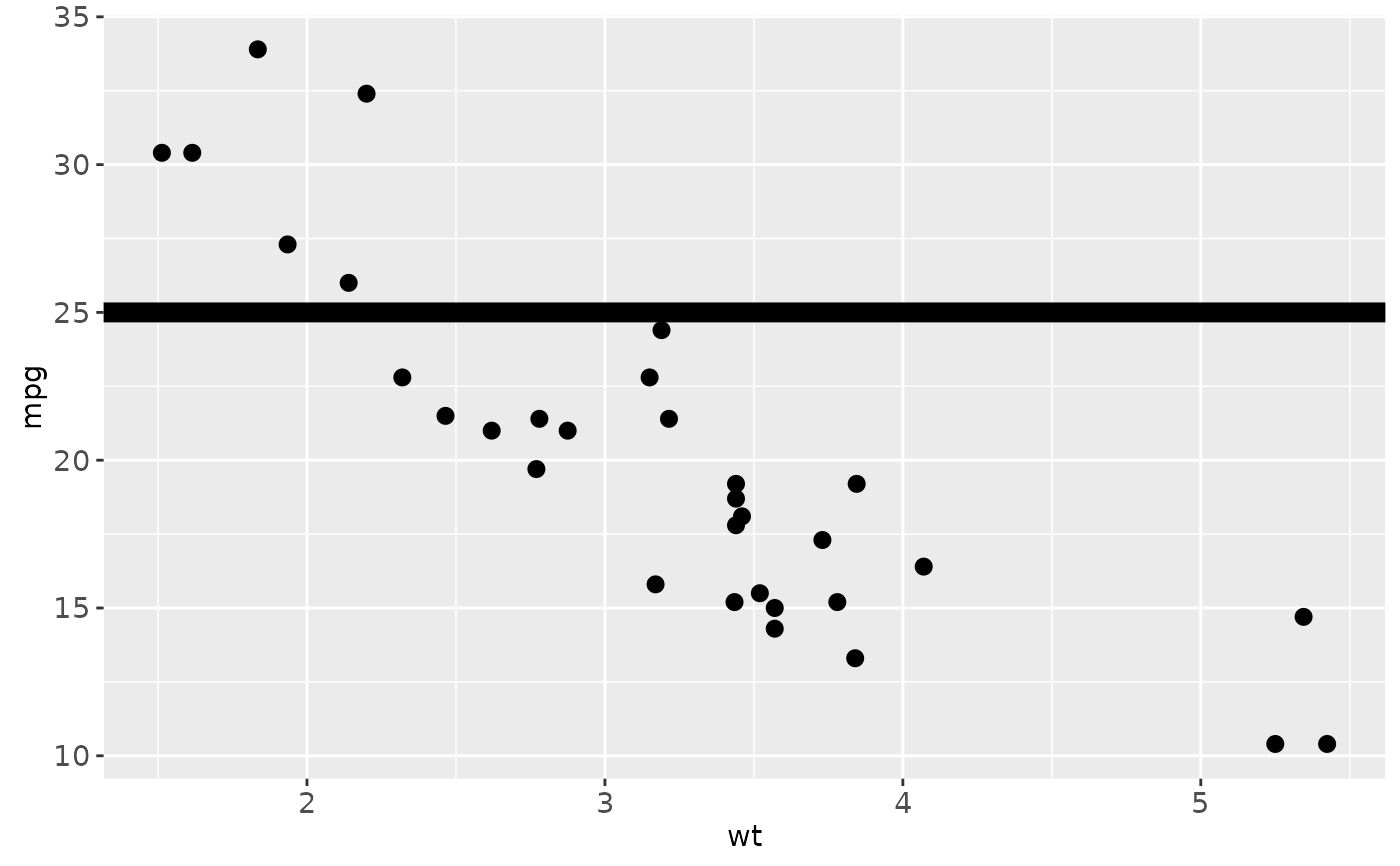
 p + geom_point(size = 2.5) +
geom_hline(yintercept = 25, size = 3.5)
 # Shape examples
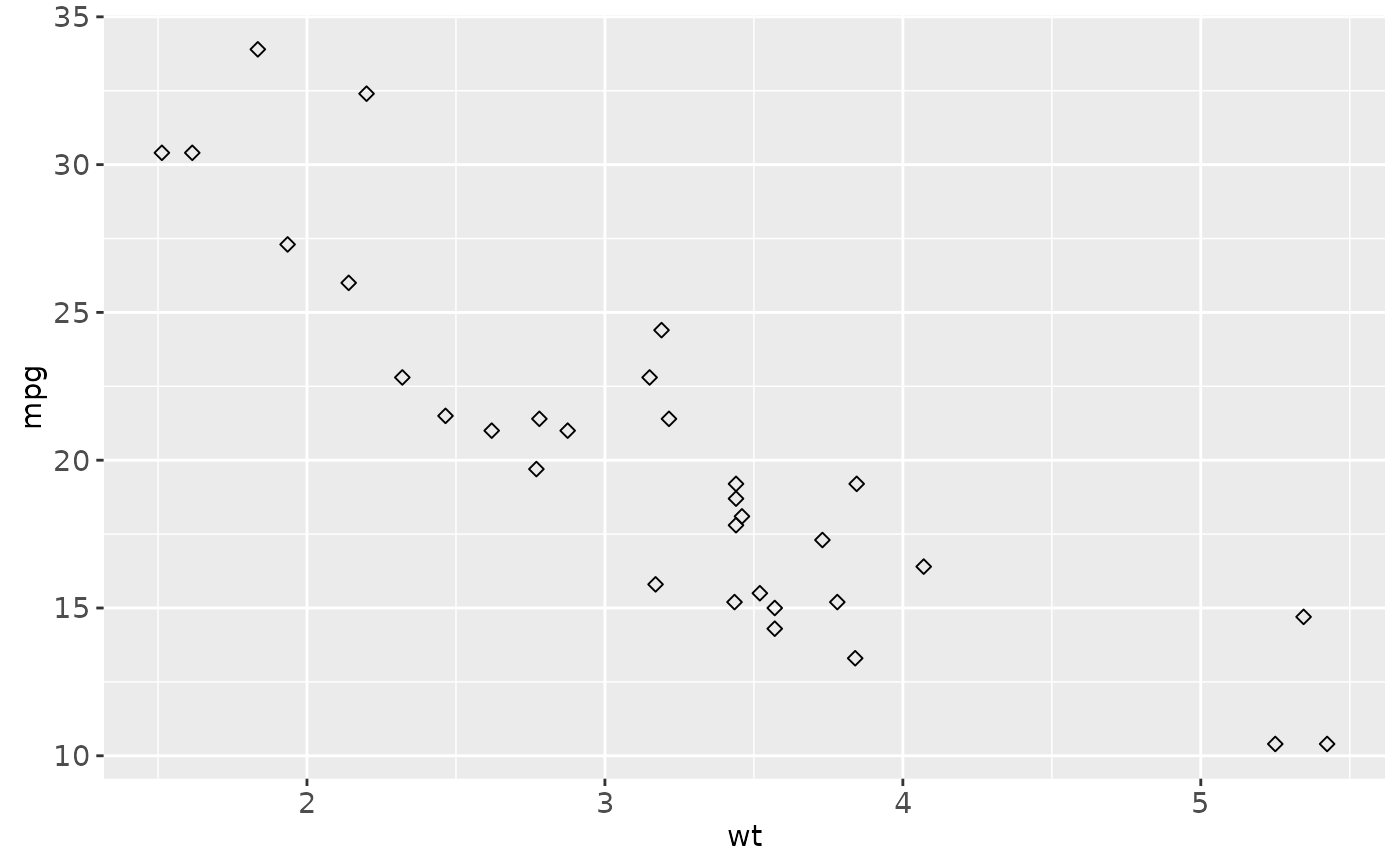
# Shape takes four types of values: an integer in [0, 25],
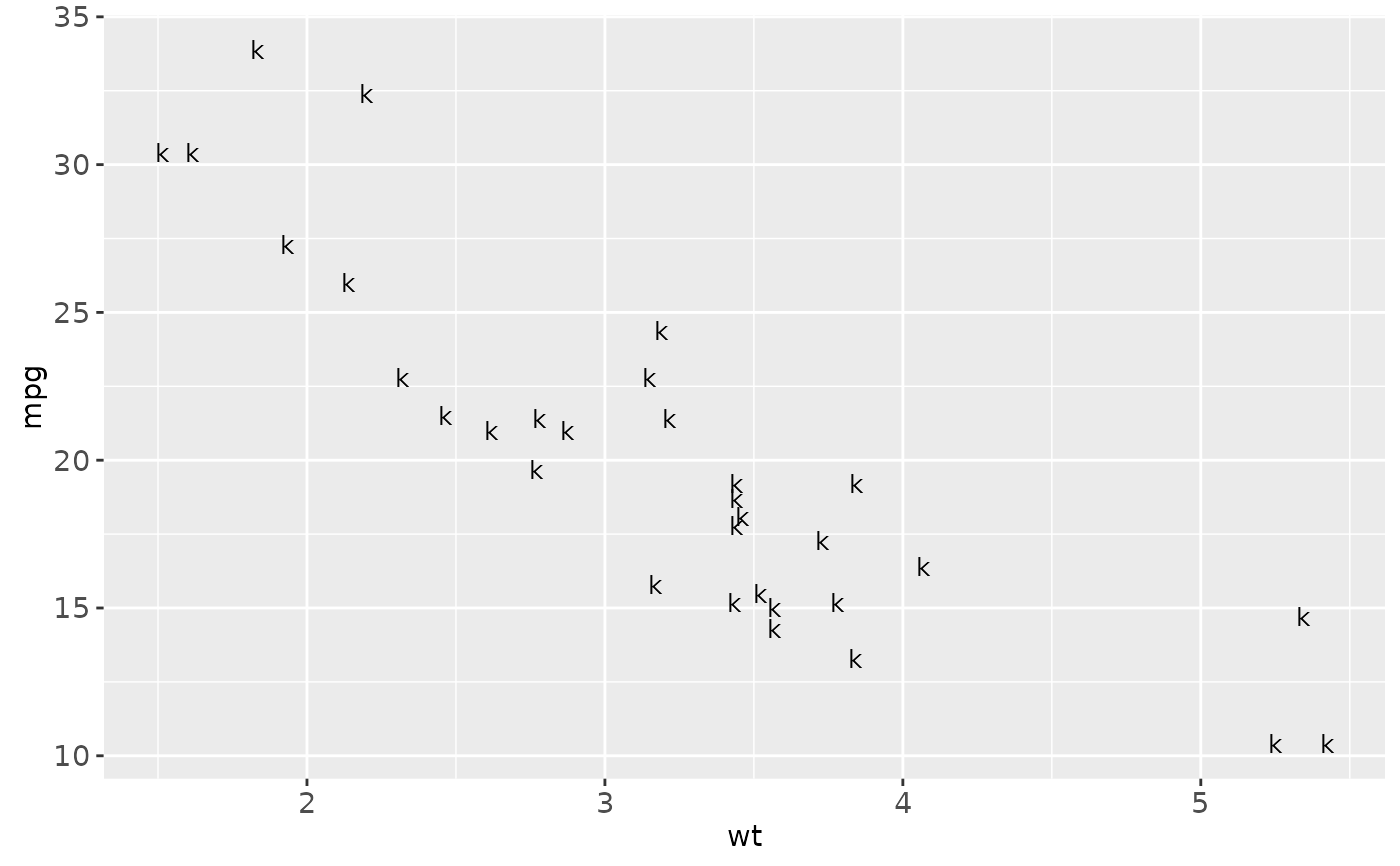
# a single character-- which uses that character as the plotting symbol,
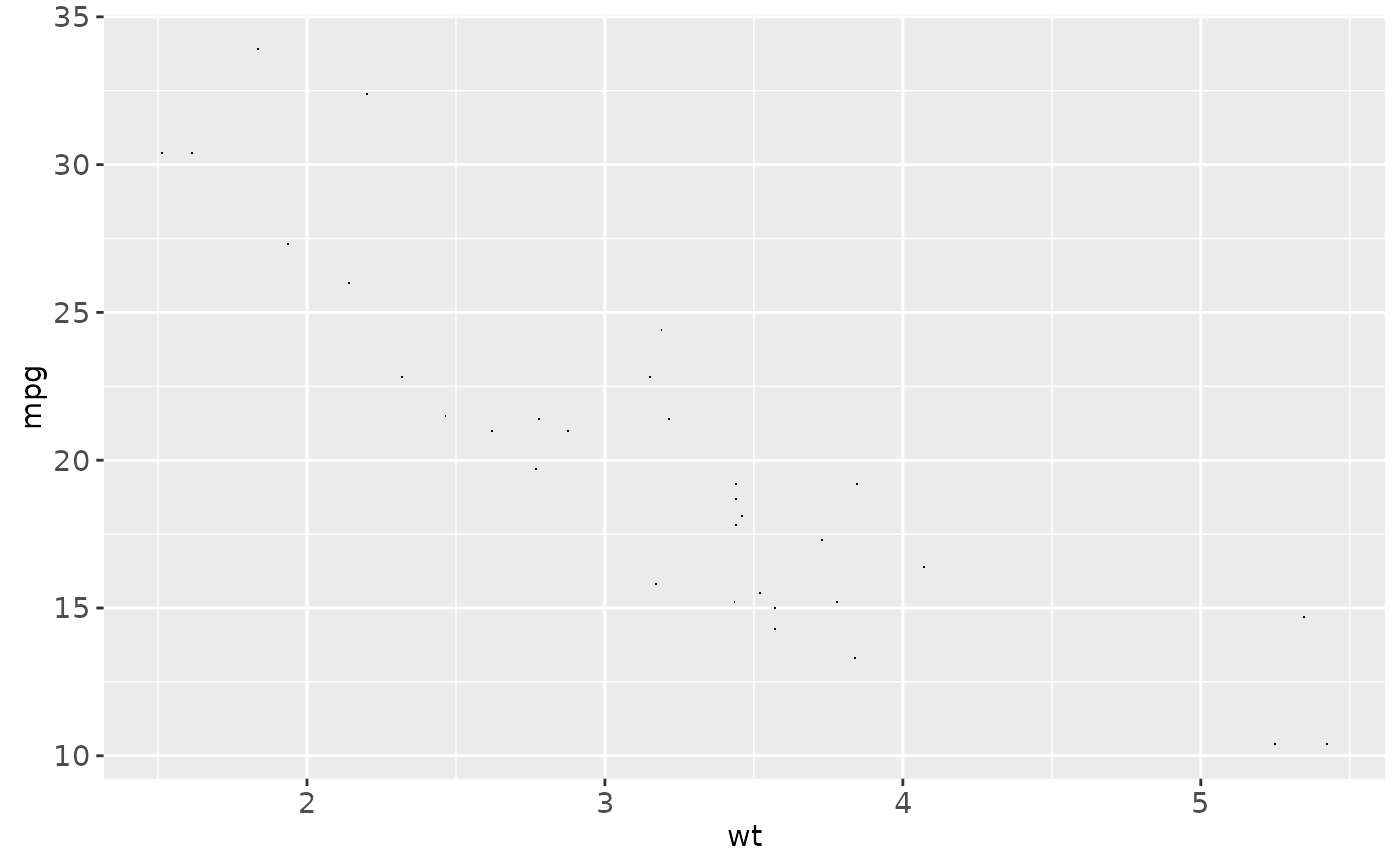
# a . to draw the smallest rectangle that is visible (i.e., about one pixel)
# an NA to draw nothing
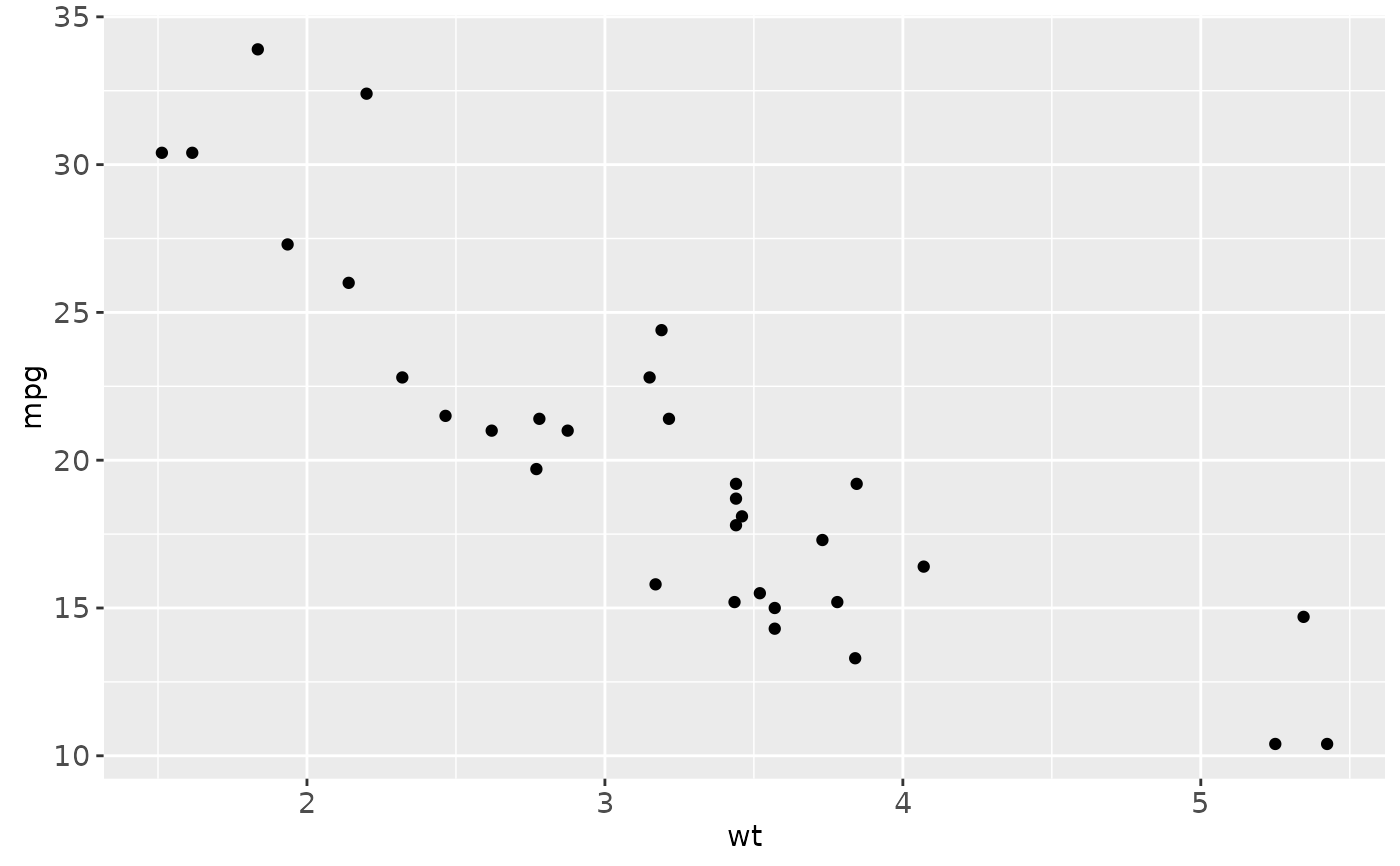
p + geom_point()
 p + geom_point(shape = 5)
 p + geom_point(shape = "k", size = 3)
 p + geom_point(shape = ".")
 p + geom_point(shape = NA)
#> Warning: Removed 32 rows containing missing values (geom_point).
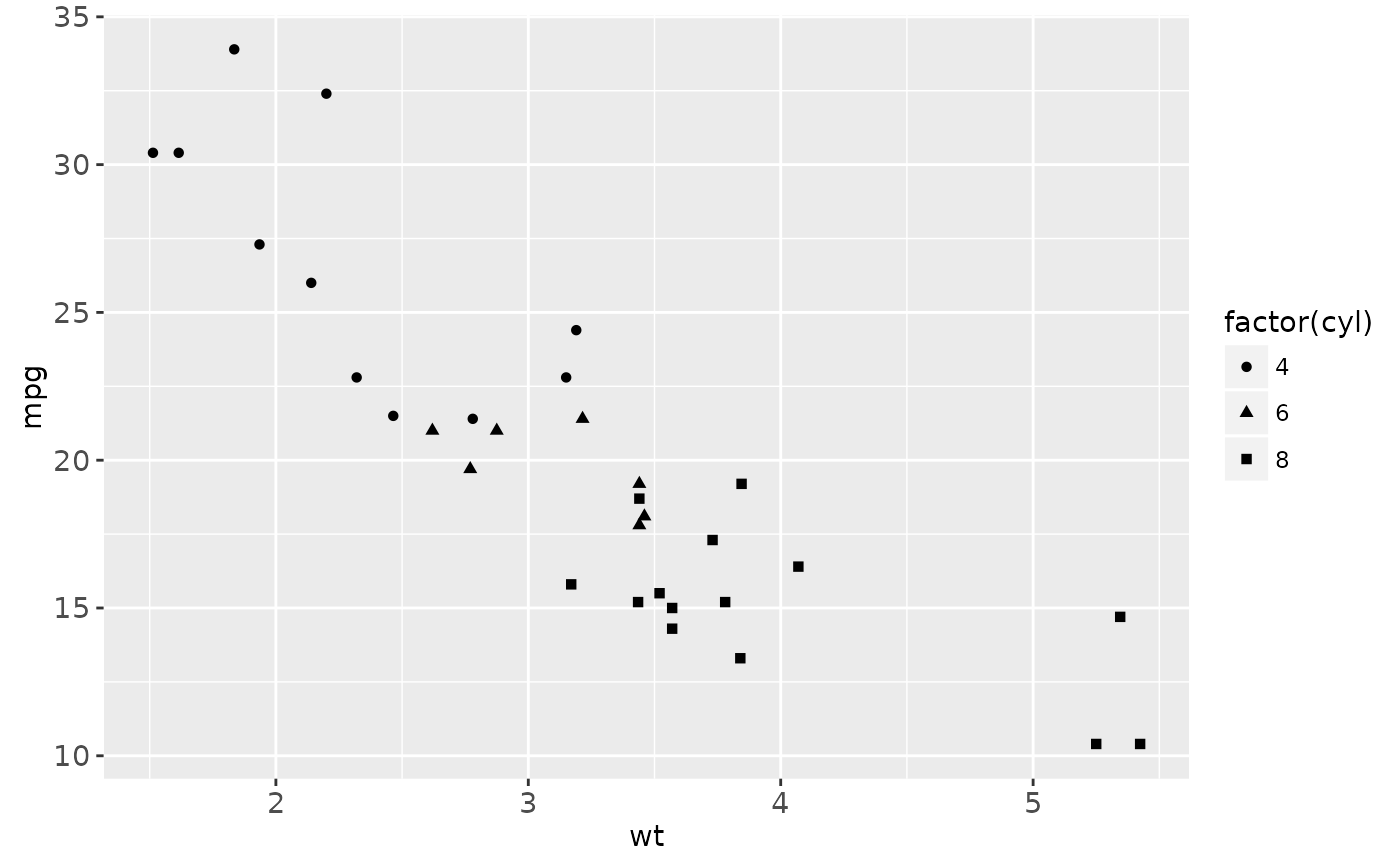
 # Shape can also be mapped from a variable
p + geom_point(aes(shape = factor(cyl)))
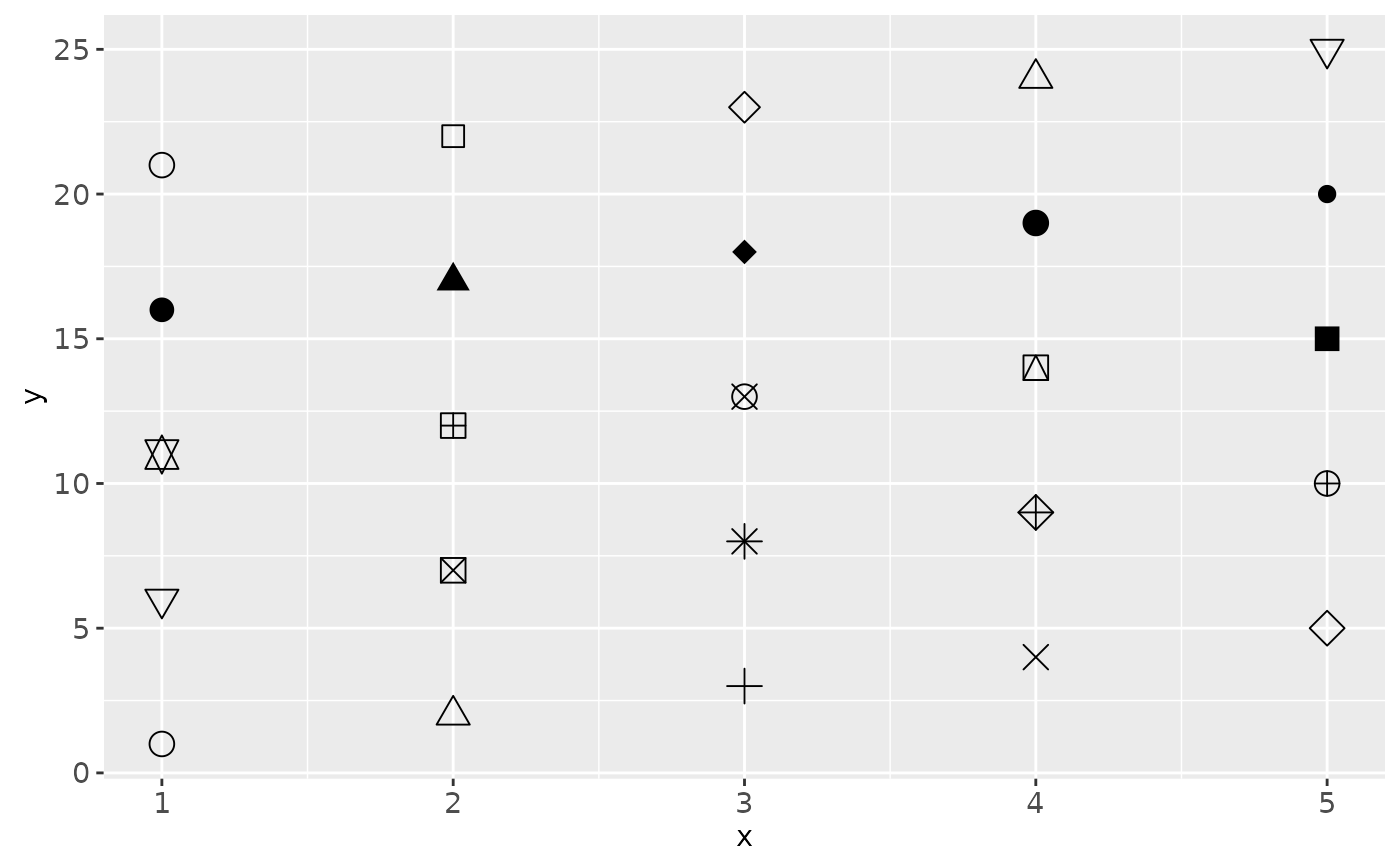
 # A look at all 25 symbols
df2 <- data.frame(x = 1:5 , y = 1:25, z = 1:25)
s <- ggplot(df2, aes(x, y))
s + geom_point(aes(shape = z), size = 4) +
scale_shape_identity()
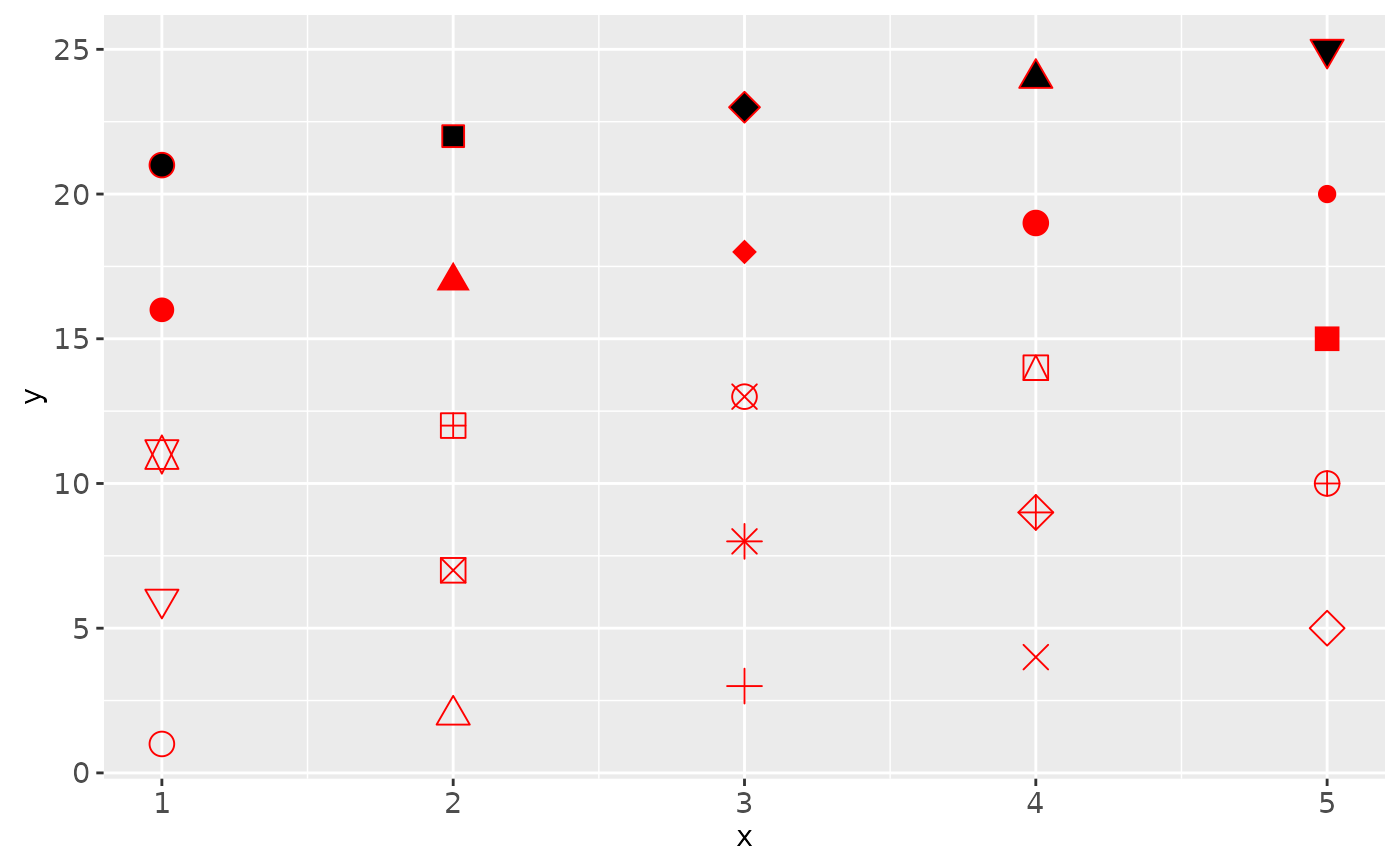
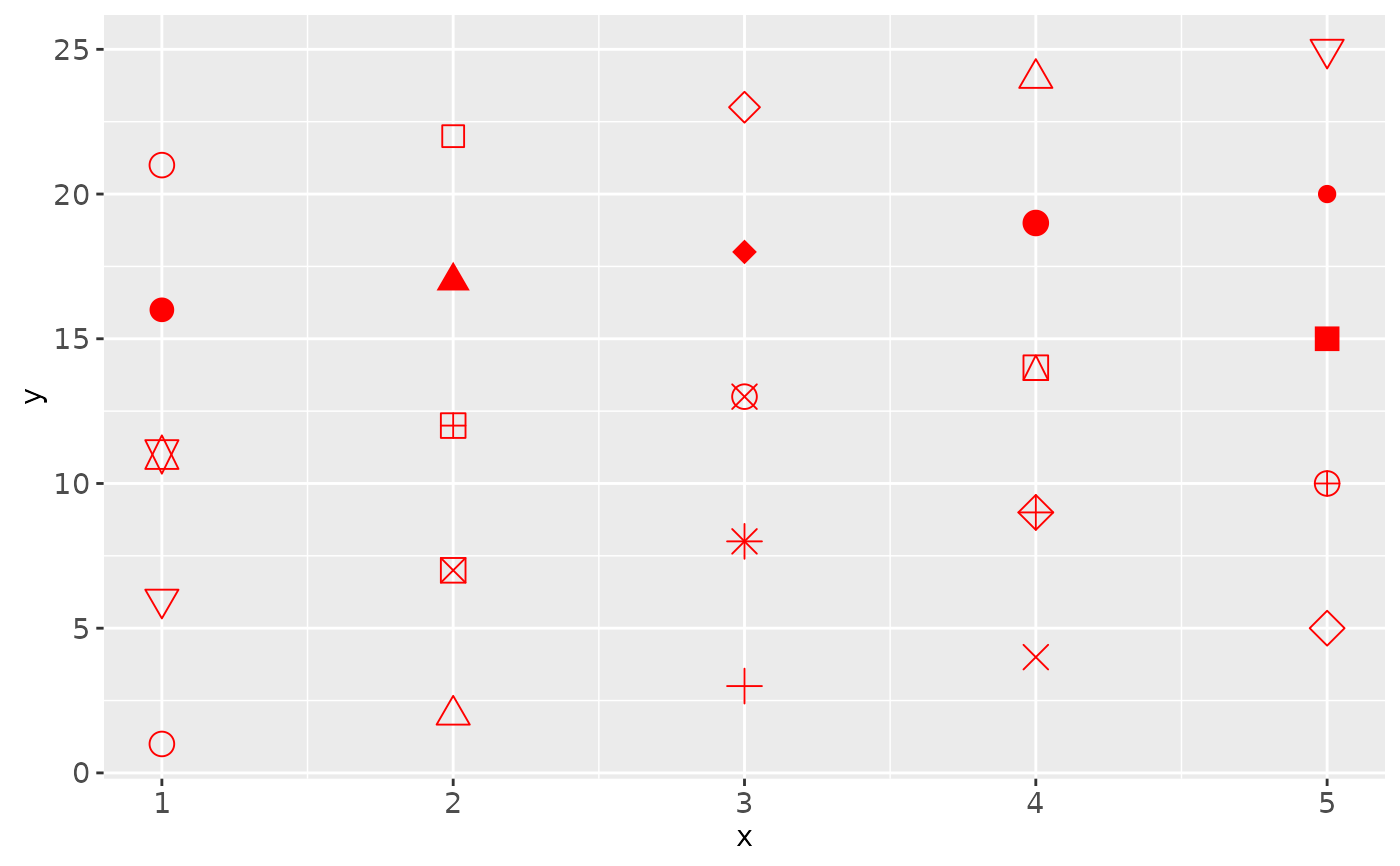
 # While all symbols have a foreground colour, symbols 19-25 also take a
# background colour (fill)
s + geom_point(aes(shape = z), size = 4, colour = "Red") +
scale_shape_identity()
 s + geom_point(aes(shape = z), size = 4, colour = "Red", fill = "Black") +
scale_shape_identity()
